Climate Alarmists Conceal Global Temperature Anomaly Measurement Declines Despite Increasing Atmospheric CO2
by Larry Hamlin
NOAA published its global climate report for year end 2021 highlighting that its global temperature anomaly measurements showed 2021 being the sixth highest of its recorded measurements. NOAA’s global annual measurement for 2021 was 0.84 degrees C.

NOAA chose to emphasize that the annual 2021 temperature anomaly was in the top ten of its recorded years as follows:
“The year culminated as the sixth warmest year on record for the globe with a temperature that was 0.84°C (1.51°F) above the 20th century average. The years 2013–2021 all rank among the ten warmest years on record.”
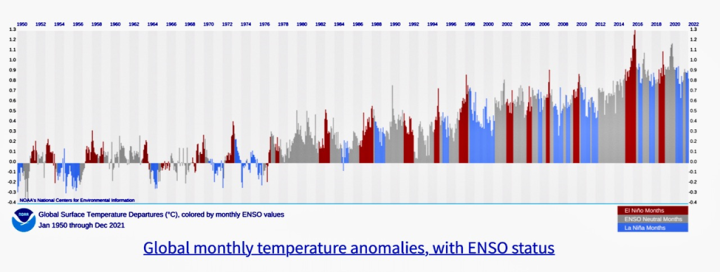
What NOAA failed to highlight was that the year-end 2021 global temperature anomaly measurement marked the continuing decline of its global temperature anomaly measurements that have now fallen for the last 6 years since peak year 2016 as shown in their graph below. These declining measurement outcomes make a complete mockery of recent climate alarmists scientifically unsupported politically contrived “climate emergency” propaganda claims.
The decline in NOAA’s global temperature anomaly measurements over the last 6 years since peak year 2016 is shown in more detail in the truncated NOAA graph below.
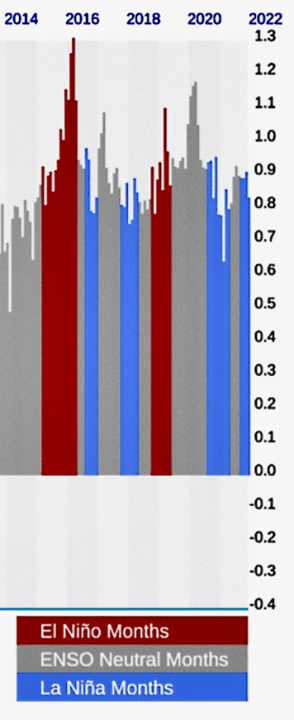
NOAA’s annual highest global temperature anomaly measurement is year-end 2016 which is now shown as 0.99 degrees C (second highest year is 2020 at 0.98 degrees C) compared to its year end 2021 annual anomaly measurement of 0.84 degrees C with a +/-0.15 degrees C confidence level. This year end 2021 global temperature anomaly measurement decline amounts to a 15% global temperature anomaly measurement collapse since peak year 2016.
Furthermore, the NOAA analysis clearly establishes that the monthly and annual global temperature anomaly measurement behaviors are strongly controlled by El Niño and La Nino events (red and blue highlighted portions of the NOAA graph respectively) which are naturally occurring climate phenomena and not driven by man made contributions to atmospheric CO2 levels.
NOAA has exaggerated the importance of both monthly and annual temperature anomaly changes with as small a difference as +0.01 degrees C as a basis for climbing “hottest temperature ever” hype as was done for the July 2021temperature anomaly data even though the confidence level for this measurement is +/-0.19 degrees C as discussed in WUWT articles here and here. Additionally, and more significantly no other global temperature anomaly measurement systems including NASA GISS, UK Met Office, UAH and RSS support NOAA’s “hottest temperature ever” hyped July claims.

NOAA’s July 2021 global temperature anomaly update release originally claimed July’s global temperature anomaly as 0.93 degrees C then changed that in the August temperature anomaly update release to 0.92 degrees C but by the November temperature anomaly update had changed the July temperature anomaly once again back to 0.93 degrees C.
NOAA makes extensive temperature anomaly measurement updates every month where large numbers of prior temperatures are changed again and again. For example, NOAA’s August 2021 temperature anomaly update compared to NOAA’s November 2021 temperature anomaly update shows that in the period between 1954 and 2021 over 250 monthly anomaly temperatures were increased always by +0.01 degrees C with about half of these upward adjustments made in the 1992 to 2021 period.
Thus, more than 1/3rd of the monthly temperature anomaly measurements between 1992 and 2021 were adjusted upward by 0.01 degrees C just between NOAA’s August and November temperature anomaly update releases. These large numbers of constantly on-going upward adjustments result in increasing changes in reported data values with for example the highest annual global temperature anomaly measurement as reported originally for year-end 2016 increasing from 0.94 degrees C to 0.99 degrees C in the year-end 2021 report.
Additionally, these NOAA updated temperature anomaly measurement adjustments between August and November 2021 for years prior to 1954 were also adjusted but in this case always downward by -0.01 degrees C for more than 100 of the prior to 1954 monthly data values.
The justification for NOAA’s never ending upward and downward large number of adjustments that always lower the long past historical data and always increases more recent historical data is extremely perplexing and clearly suggests concerns that these changes are driven by climate alarmist politics (especially by the Biden and other Democratic Party Administrations) versus credible science.
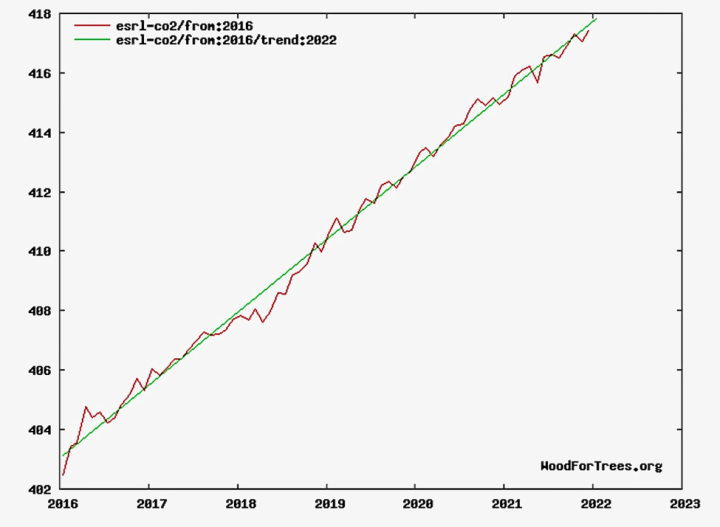
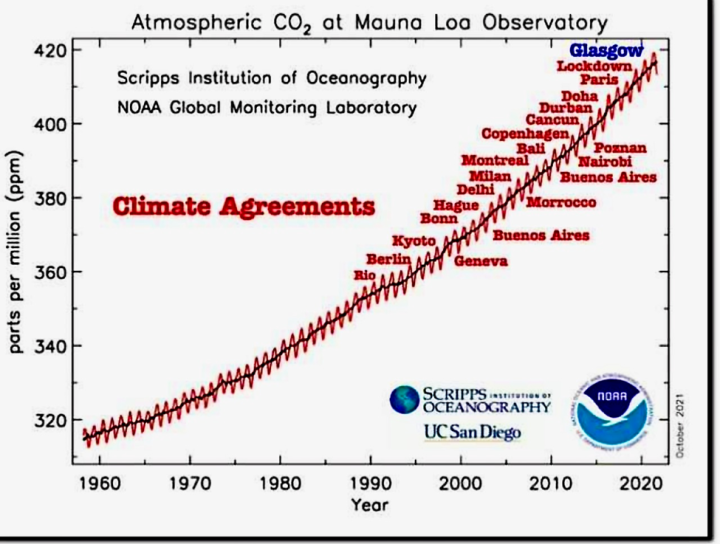
The global yearly annual temperature anomaly decline between year-end 2016 and year end 2021 has occurred despite continuing increases in global atmospheric CO2 levels as shown in the graph below showing CO2 atmospheric concentrations growing from 402 ppm to 417 ppm based on measurements from the Mauna Loa Observatory. Flawed and failed climate “models” would of course depict increasing global temperature anomaly outcomes from this data.
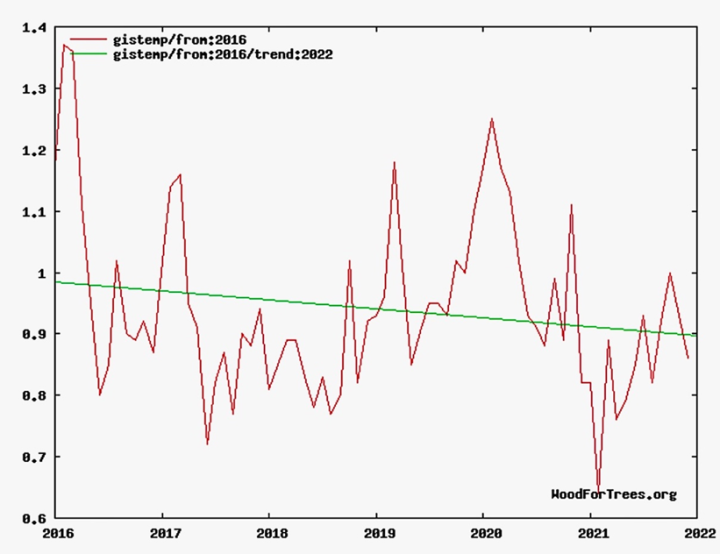
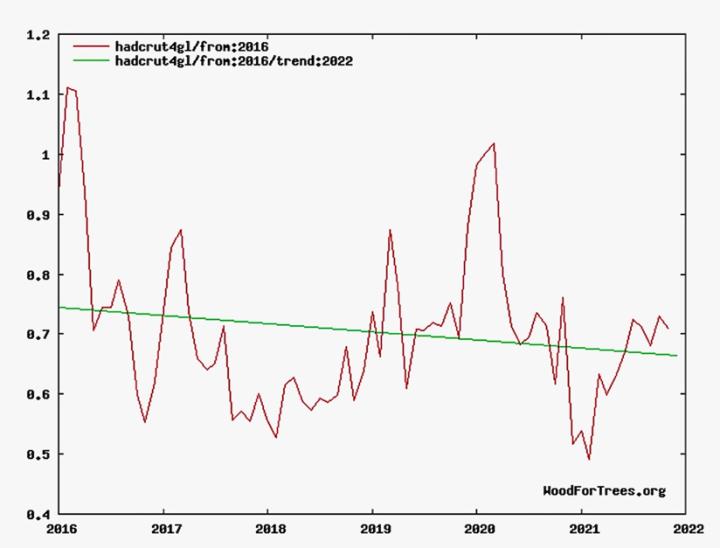
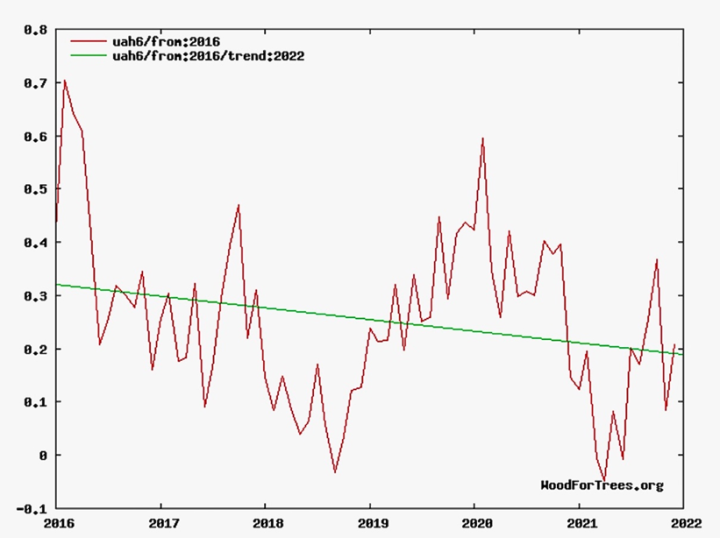
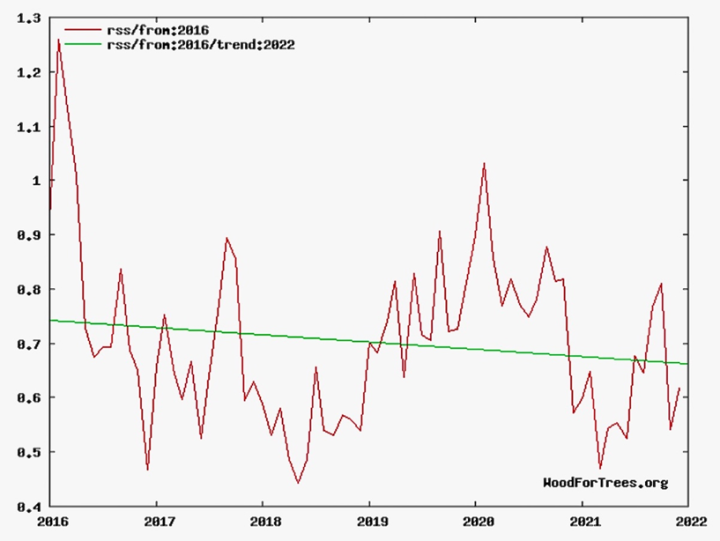
In addition to NOAA’s global temperature anomaly decline since year end 2016 all other global temperature anomaly measurement systems used by climate scientists worldwide all show declining global temperature anomaly measurements during the period from 2016 through 2021 as shown in the graphs below for surface global temperature anomaly measurement systems from NASA GISS and UK Met Office and for satellite global temperature anomaly measurement systems from UAH and RSS respectively.
Despite the usual climate alarmist grossly exaggerated hype by NOAA and NASA in their year 2021 annual reports trying to conceal the clearly obvious downward global temperature anomaly measurement trends while global atmospheric CO2 levels are continuing to climb the annual global temperature anomaly outcomes for year-end 2021 and the last six years do not support and in fact clearly dispute recent climate alarmist claims that we are in a “climate emergency” driven by man-made CO2 missions.
Actual global temperature anomaly measurements by NOAA, NASA, UK Met Office, UAH and RSS all show downward anomaly trends versus the upward climate “computer models” temperature anomaly trends with these speculative “model” trends unsupported by measured data. The failed debacle of the last COP26 climate alarmist confab seems clearly appropriate based upon these latest global temperature anomaly measurement results.
However, all these politically contrived climate alarmist driven COP cabals that commenced in the 1990s have a spectacular track record of failure as noted above.
#
2021 was the sixth hottest year on record
2021 Tied for 6th Warmest Year in Continued Trend, NASA Analysis Shows (Claims)
#
Larry Hamlin: NOAA published its global climate report for year end 2021 highlighting that its global temperature anomaly measurements showed 2021 being the sixth highest of its recorded measurements. NOAA’s global annual measurement for 2021 was 0.84 degrees C. … NOAA has exaggerated the importance of both monthly and annual temperature anomaly changes with as small a difference as +0.01 degrees C as a basis for climbing “hottest temperature ever” hype as was done for the July 2021 temperature anomaly data even though the confidence level for this measurement is +/-0.19 degrees C as discussed in WUWT articles here and here. …
More than 1/3rd of the monthly temperature anomaly measurements between 1992 and 2021 were adjusted upward by 0.01 degrees C just between NOAA’s August and November temperature anomaly update releases. These large numbers of constantly on-going upward adjustments result in increasing changes in reported data values with for example the highest annual global temperature anomaly measurement as reported originally for year-end 2016 increasing from 0.94 degrees C to 0.99 degrees C in the year-end 2021 report. …
In addition to NOAA’s global temperature anomaly decline since year end 2016 all other global temperature anomaly measurement systems used by climate scientists worldwide all show declining global temperature anomaly measurements during the period from 2016 through 2021 as shown in the graphs below for surface global temperature anomaly measurement systems from NASA GISS and UK Met Office and for satellite global temperature anomaly measurement systems from UAH and RSS respectively.
Despite the usual climate alarmist grossly exaggerated hype by NOAA and NASA in their year 2021 annual reports trying to conceal the clearly obvious downward global temperature anomaly measurement trends while global atmospheric CO2 levels are continuing to climb the annual global temperature anomaly outcomes for year-end 2021 and the last six years do not support and in fact clearly dispute recent climate alarmist claims that we are in a “climate emergency” driven by man-made CO2 missions.