By Physicist Dr. Ralph Alexander
According to a new research study by NOAA (the U.S. National Oceanic and Atmospheric Administration), aerosol pollution plays a major role in hurricane activity. The study author claims that a recent decline in atmospheric pollutants over Europe and the U.S. has resulted in more hurricanes in the northern Atlantic Ocean, while a boost in aerosols over Asia has suppressed tropical cyclones in the western Pacific.
But this claim, touted by the media, is faulty since the study only examines changes in aerosol emissions and hurricane frequency since 1980 – a selective choice of data becoming all too common among climate scientists trying to bolster the narrative of anthropogenic climate change. The aerosol pollution is mostly in the form of sulfate particles and droplets from industrial and vehicle emissions. When pre-1980 evidence is included, however, the apparent connection between aerosols and hurricanes falls apart.
Let’s look first at the north Atlantic. Data for the Atlantic basin, which has the best quality data in the world, do indeed show heightened hurricane activity over the last 20 years, particularly in 2005 and 2020. You can see this in the following figure, which illustrates the frequency of all major Atlantic hurricanes as far back as 1851. Major hurricanes (Category 3 or greater) have a top wind speed of 178 km per hour (111 mph) or higher. The recent enhanced activity is less pronounced, though still noticeable, for Category 1 and 2 hurricanes.

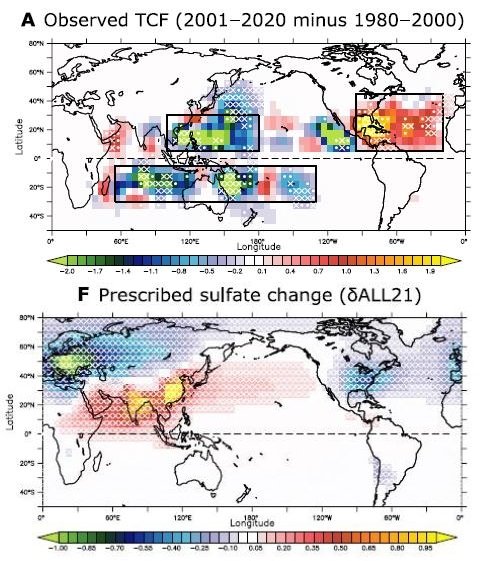
The next figure shows the observed increase in Atlantic hurricane frequency (top), from the 20 years between 1980 and 2000 to the 20 years between 2001 and 2020, compared to the NOAA study’s simulated change in sulfate aerosols during the same interval (bottom).

The hurricane frequency TCF is for all (Categories 1 through 5) hurricanes, with positive and negative color values denoting higher and lower frequency, respectively. A similar color scheme is used for the sulfate calculations. Both the Atlantic increase and western Pacific decrease in hurricane frequency are clearly visible, as well as the corresponding decrease and increase in aerosol pollution from 1980 to 2020.
But what the study overlooks is that the frequency of major Atlantic hurricanes in the 1950s and 1960s was at least comparable to that in the last two decades when, as the figure shows, it took a sudden upward hike from the 1970s, 1980s and early1990s. If the study’s conclusions are correct, then pollution levels in Europe and the U.S. during the 1950s and 1960s must have been as low as they were from 2001 to 2020.
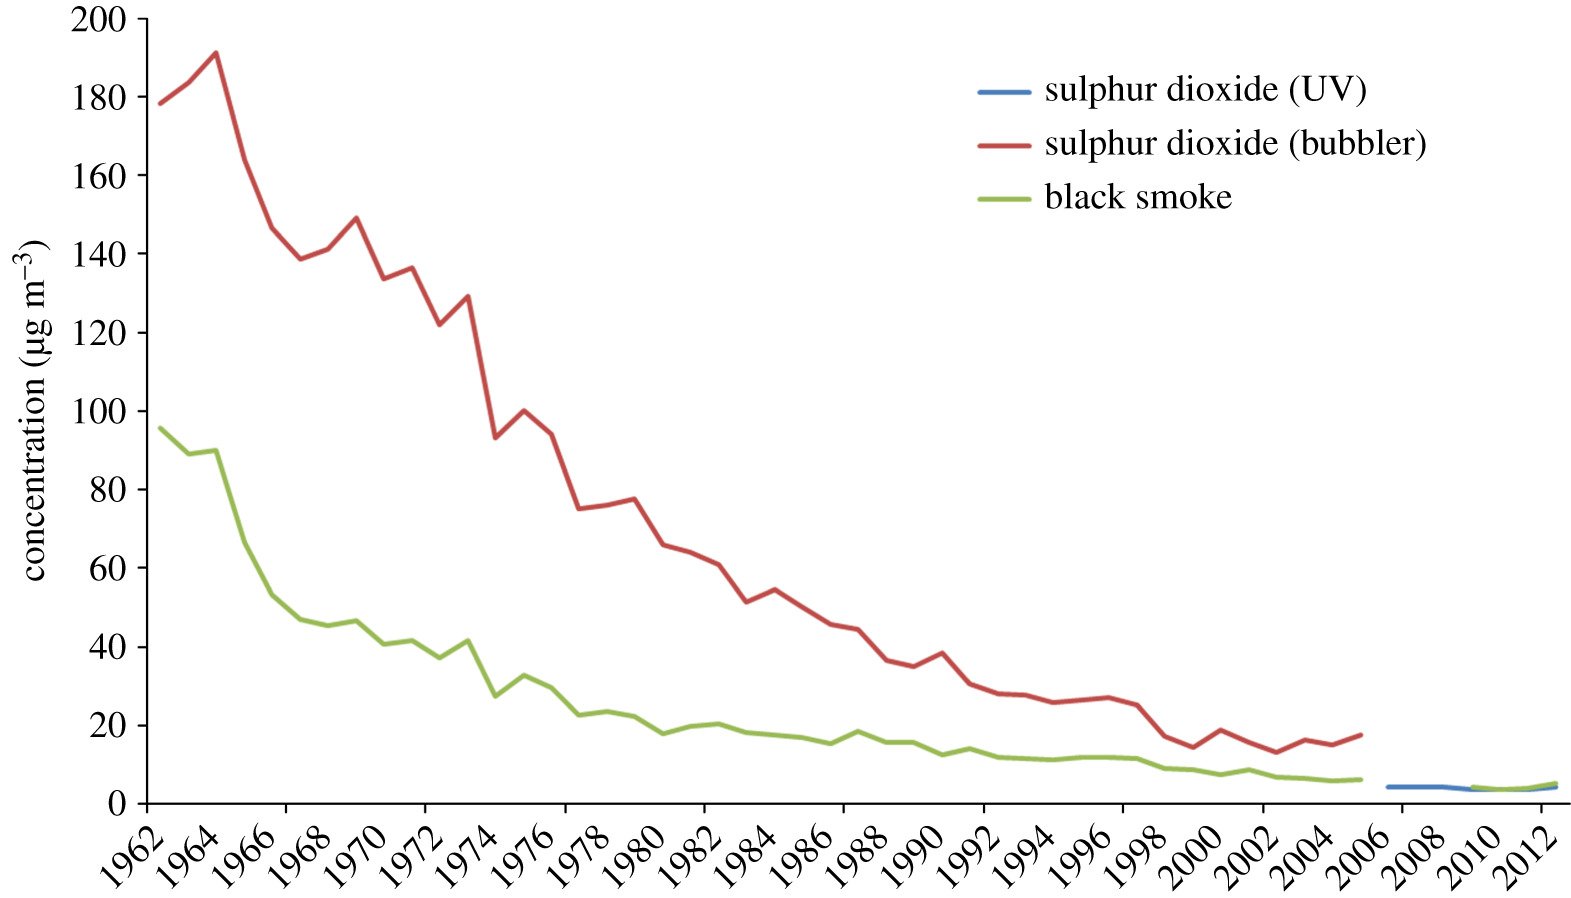
However, examination of pollution data for the north Atlantic reveals that the exact opposite is true: European and U.S. aerosol concentrations in the 1960s were much higher than in any later decade, including decades after 1980 during the study period. This can be seen in the figure below, which depicts the sulfate concentration in London air over the 50 years from 1962 to 2012; similar data exists for the U.S. (see here, for example).

Were the NOAA study valid, such high aerosol levels in European and U.S. skies during the 1960s would have decreased north Atlantic hurricane activity in that period – the reverse of what the data demonstrates in the first figure above. In the Pacific, the study links a supposed reduction in tropical cyclones to a well-documented rise in aerosol pollution in that region, due to growing industrial emissions.
But a close look at the bottom half of the second figure above shows the increase in pollution since 1980 has occurred mostly in southern Asia. The top half of the same figure indicates increased cyclone activity near India and the Persian Gulf, associated with higher, not lower pollution. The only decreases are in the vicinity of Japan and Australia, where any changes in pollution level are slight.
The NOAA study aside, changes in global hurricane frequency are much more likely to be associated with naturally occurring ocean cycles than with aerosols. Indeed, NOAA has previously linked increased Atlantic hurricane activity to the warm phase of the Atlantic Multidecadal Oscillation (AMO).
The AMO, which has a cycle time of approximately 65 years and alternates between warm and cool phases, governs many extremes, such as cyclonic storms in the Atlantic basin and major floods in eastern North America and western Europe. The present warm phase began in 1995, triggering a more tempestuous period when both named Atlantic storms and hurricanes have become more common on average.
Another contribution to storm activity in the Atlantic comes from La Niña cycles in the Pacific. Apart from a cooling effect, La Niñas result in quieter conditions in the eastern Pacific and enhanced activity in the Atlantic. In the U.S., major landfalling hurricanes are tied to La Niña cycles in the Pacific, not to global warming.


