A Liberal MLA from northern B.C. has been kicked out of his party’s caucus after reposting a tweet that supports carbon dioxide as an essential element of life rather than a catalyst for global warming.John Rustad, who represents the riding of Nechako Lakes, was removed from the BC Liberal Party on Aug. 18 after he shared a Twitter post by Greenpeace co-founder Patrick Moore challenging the idea that carbon dioxide is the “control knob of global temperature” regarding climate change.
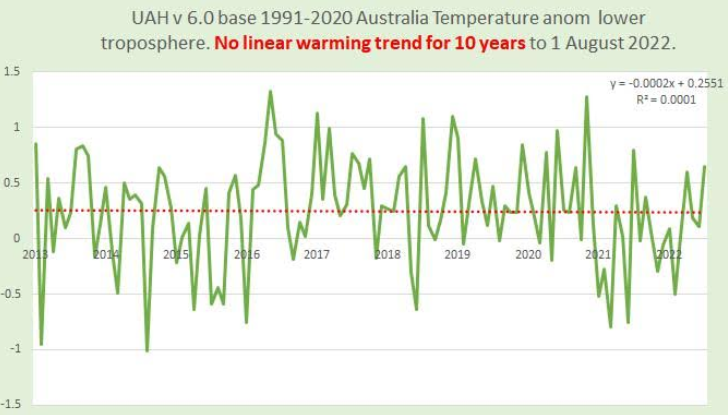
Moore’s tweet included an article by Australian writer Tony Thomas who cited research that there has been “no linear warming trend for 10 years to 1 August 2022” in Australia, and that the Great Barrier Reef is currently “enjoying the largest area of coral cover ever recorded.”Thomas’s article was published on Quadrant Online, an Australian literary, cultural, and political journal, on Aug. 14.
Rustad was first elected as a BC Liberal MLA in 2005. Prior to his role as opposition critic on forests, lands, and natural resource operations in 2017, he served as aboriginal relations minister and forests minister under Christy Clark’s Liberals.
The outspoken critic, who worked in the forest industry for over 20 years, drew criticism from BC Liberal Party Leader Kevin Falcon who stressed that Rustad does not speak on behalf of caucus on the climate change issue.
“Let me be clear, #ClimateChange is one of the most critical threats facing our future,” Falcon said on Twitter on Aug. 17. “The @bcliberals are strongly committed to substantive climate action & restoring BC’s place as a world leader in climate policy. @JohnRustad4BC does not speak on behalf of caucus on this issue.”
Falcon followed up with a statement the next day, saying that “politics is a team sport, and British Columbians expect their elected officials to work co-operatively on the important issues facing our province.”
“Following a pattern of behaviour that was not supportive of our caucus team and the principles of mutual respect and trust, I have removed MLA John Rustad from the BC Liberal Caucus effective immediately,” he said.
The opposition leader said in another tweet on Aug. 18 that Kamloops-South Thompson MLA Todd Stone will serve as interim forestry critic.
‘Essential Component of Life’
In his response hours later, Rustad defended his stance on the tweet.
“I believe in climate change. I know, as British Columbians, we impact our climate. Like many, I am concerned about the effects of climate change and how it will affect our future and the next generation,” he wrote on Twitter on Aug. 18.
“However, I refuse to support policies brought forward by environmental elitists to punish everyday British Columbians and families who are already dealing with out of control inflation.”
Rustad has been outspoken in his defence of carbon dioxide. He argued against using the word “pollution” to describe it in the B.C. legislative assembly last April.
“Carbon dioxide is an essential component of life on this planet. It is not a pollution. That sort of misinformation out there is just ridiculous,” he said.
“It doesn’t serve anybody well. It doesn’t serve the environmental movement well. It doesn’t serve us as a province well. A poor choice of words. That’s the raspberry.”
#
https://quadrant.org.au/opinion/doomed-planet/2022/08/a-clear-case-of-hot-hotter-hoodwinked/
A Clear Case of Hot, Hotter … Hoodwinked
Australia’s climate alarmists are having a terrible month. Green/Left worrywarts such as the Australian Academy of Science are struggling to cope with the Great Barrier Reef enjoying the largest area of coral cover ever recorded. That’s after the Academy’s doom-crying since 2012, which is as far back as I’ve bothered to track its Reef fulminations.[1]
And there’s another shock for lovers of windmills and made-in-China solar panels. According to the UAH temperature satellites that have been criss-crossing the continent for 40 years, Australia shows no warming for precisely the past decade. Suppose you’re teaching ten-year-olds, and you don’t care about your career in the education system. You could announce, “Hey, kids, there’s not been a jot of warming here since Mummy brought you home from the maternity wing.”
The statement, “No Australian warming for the ten years to end-July” risks giving apoplexy to alarmists. And globally, UAH satellite readings to end-of-June show no warming for seven years and 10 months. The ground-based HadCRUT series likewise shows no warming for 86 months. For Australian climes, whether the pause continues depends on whether we get another el Nino (warming) or la Nina (cooling). In neither case have CO2 emissions been shown to have much or anything to do with it.
Our local alarmists’ shtick has been that our continental “heating emergency” has spurred bushfires, floods, droughts and cyclones. The CSIRO, the Bureau of Meteorology and Tim Flannery’s Climate Council might as well put out a joint press release: “Sorry, damn, we got that all wrong.”
They won’t, of course. What they’ll do is argue that land-based temperature measuring is superior to UAH satellite read-outs, ten years is too short to matter, and any fool can cobble-up suitable trend-lines on a wiggly graph. Hence one needs to get into technicalities, which are actually quite interesting.
♦ The ten-year halt to local warming is not a ‘cherry-pick’. It is calculated by a method taking all months into account. Indeed it’s the method recommended by the godfather of global temperature measuring, Prof Phil Jones of the early HadCRUT global temperature series, also of 2009 Climategate email fame.[2]
♦ Ten years’ halt is not “too short to matter”. It upsets all those claims that the alleged climate crisis is “even worse than expected.” If it was ten years’ warming, bet your life that the alarmists would be making a song and dance about it. No climate models forecast such a halt, nor did they predict the previous global halt that lasted 18 years and eight months to November 2015.
These long halts suggest why the climate models have predicted twice as much warming as has actually occurred. As the 2013 IPCC report glumly reported, 111 out of 114 of its climate-model runs overshot the actual warming.[3] But they’re still the basis for trillions of investment in renewables and “net zero” wild-goose spending.
♦ Why are satellite readings better than the Bureau of Meteorology’s ACORN-SAT Series 2.2 land-based measurements?[4] Largely because ACORN derives from just 112 Stevenson screens (temperature-measuring boxes), representing our 7.7m square kilometre continent. There are big gaps in coverage of the important weather-generating Northern Territory. Many of the 112 screens are biased upwards by the urban heat island effect, i.e. the growth of concrete, tarmac, buildings and population around boxes originally sited amid light breezes on green paddocks.
ACORN’s bad reputation among sceptics also stems from the bureau’s serial revisions and black-box “homogenisation” of raw data, virtually all generating steeper warming trends. In contrast, the UAH satellites continually sweep our entire land mass.[5] The UAH data revisions are purely technical and transparent, such as adjusting for the decay of orbits.
In more detail, the satellites are launched by NASA and managed by NOAA — the US National Oceanic and Atmospheric Administration which includes official weather forecasting. Drs Roy Spencer and John Christy at the University of Alabama at Huntsville (UAH) monitor about 15 instruments on the satellites. These measure the microwave thermal emissions from oxygen in the lower troposphere, which means the air from near sea level to about 14 kilometres up. (Land-based measurements are taken just 1.2 metres from the surface). The satellites’ emission readings are proportional to temperature and the UAH team does the data conversion and adjustments.
Are the UAH adjusted measurements reliable? Yes, because they provide data consistent with independent data from radiosonde measurements on weather balloons. Thousands of these balloons are launched every day. The UAH data are also fully independent of land-based data and validated by major US institutions like USCRN, CERES, and ERBS.[6][7]
On the global scale, satellite coverage is, of course, vastly superior to the three main terrestrial global temperature measuring systems HadCRUT, NASA-GISS and NOAA, which lack coverage of significant areas of the earth’s surface. Gaps includes the poles, large ocean areas, and much of Siberia and the African continent’s 30 million square kilometres. This has given licence to climate scientists to just “make up” a lot of the data, including record-breaking heat where there happens to be no weather stations.[8] The Climategate emails also show the Phil Jones top team conspiring to alter their HadCRUT data to offset inconveniently cool results.[9]
The HadCRUT data, which underpins the entire global climate scare and trillion-dollar net-zero investments, was never independently audited until 2018 when Melbourne researcher Dr John McLean ran an audit for his successful PhD thesis. He found messes and anomalies that would not be officially tolerated even in minor company accounts.[10]
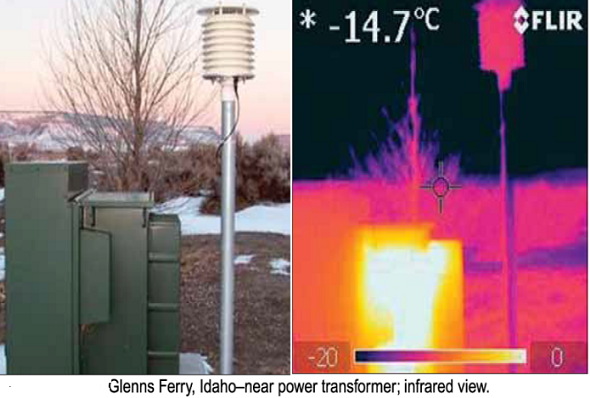
The BoM is not Robinson Crusoe in regard to its degraded weatherbox sitings. The US government has the densest and longest sets of temperature records, but research released last month by Anthony Watts shows that 96 per cent of the 1000-plus US NOAA stations sampled (of more than 10,000) violate NOAA’s own siting guidelines and are biasing warming rates upwards. The problem is actually worse than in 2009 when a similar survey – endorsed by government US watchdogs Office of the Inspector General (OIG) and the Government Accounting Office (GAO) – found 89 per cent were corrupted by the heat-island and other siting defects. The warming trend was twice the rate of the trend using only compliant-sited stations.[11] Watts explains, “By contrast, NOAA operates a state-of-the-art surface temperature network called the U.S. Climate Reference Network. It is free of localized heat biases by design, but the data it produces is never mentioned in monthly or yearly climate reports published by NOAA for public consumption.”
AS FOR Australian temperatures, our Bureau of Meteorology shows barely a flicker of interest in the inconvenient UAH coverage of Australia. BoM’s warming temperature trend is showing a widening inconsistency with UAH satellite read-outs.
It’s a pity that then-PM Malcolm Turnbull and Environment Minister Greg Hunt scotched the plan by ex-PM Tony Abbott in 2014 to get a proper independent audit done of the BoM ACORN series.[12] (When Abbott won the Opposition leadership from Turnbull in 2009 by one vote, Hunt voted against him. To get Hunt onside, Abbott then offered him the climate portfolio, and lawyer Hunt agreed — but only on conditions including “That the science of climate change was never challenged”).[13]
In the event, Hunt recruited his own panel which reported in 2017 that ACORN was “well maintained and represents an important source of information on the climate trends affecting Australia.”[14] Australia nonetheless owes a continuing debt to amateur and more critical auditors of the BoM such as Townsville ex-headmaster Ken Stewart, Perth journalist Chris Gillham, and Port Macquarie retired scientist Dr Bill Johnston
Townsville’s Ken Stewart has run a study finding a fairly close match in trends in the BoM series and the UAH satellite trends, but considers recent BoM warming assertions are due to faults in the BoM maximum daily temperature series.
In another study by Stewart, assisted by Perth’s Gilliam, Stewart notes that BoM previously ran a Mark 1 Acorn-Sat series which was highly praised internationally in 2011 as “an important long-term national asset”.[15] The BoM barely a year later mysteriously withdrew it and replaced it with an adjusted Mark 2 version, based on the same raw data. The adjustments — normally used for good technical reasons — increased our warming trend from 0.09degC warming per decade to 0.13degC per decade to 2022. This came about from lowering adjusted temperatures before 1971 and raising them after, Stewart’s audit shows. This “increased warming” of up to 0.4degC per century is entirely from dubious adjustments, not changes in measured data.
The BoM/CSIRO systems of temperature adjustments was OK’d by a panel of four supposed “world-leading experts” from countries where the adjustments are also contentious – especially New Zealand with its notorious adjustment bias towards warming. No wonder the BoM is now at loggerheads with the satellites.
The CITED BoM Australian-average temperature records using screens only start in 1910, although its data for Melbourne goes back to 1855. If the long-term records included the searing heat and drought of the 1890s and earlier, today’s warming would look less alarming.
It’s disappointing that even the measurement of our mild global warming (which has proceeded since the 18th century’s Little Ice Age) has become politicised, corrupted and tweaked to suit the alarmist narrative. Who’d dare to say, “Trust me, I’m a climate scientist”?
Tony Thomas’ latest essay collection “Foot Soldier in the Culture Wars” ($29.95) is available from publisher ConnorCourt
[1] AAS 2012: Ticking time bombs in the human-earth system
[2] Statistically, “the period from the earliest month starting with which the least-squares linear-regression trend to the most recent month does not exceed zero.”
[3] Chapter 9, text box 9.2, page 769.
[4] ACORN-SAT: Australian Climate Observations Reference Network – Surface Air Temperature.
[5] The “homogenisation” is a black-box process eschewing transparency.
[6] U.S. Climate Reference Network (USCRN), Clouds and the Earth’s Radiant Energy System (CERES).
[7] There’s a rival California-based group called RSS which also monitors satellite-based temperatures. Their series agrees more with land-based measurements but is not independent of them and is part-reliant on modelling estimates.
[8] Phil Jones: “For much of the SH [Southern Hemisphere] between 40 and 60S the normals are mostly made up as there is very little ship data there.”
[9] 2009 Climategate email from climate scientist Tom Wigley: “Phil [Jones], Here are some speculations on correcting SSTs [sea surface temperatures] to partly explain the 1940s warming blip. If you look at the attached plot you will see that the land also shows the 1940s blip (as I’m sure you know). So, if we could reduce the ocean blip by, say, 0.15 degC, then this would be significant for the global mean — but we’d still have to explain the land blip. I’ve chosen 0.15 here deliberately.”
[10] McLean: “It’s very careless and amateur. About the standard of a first-year university student … Governments have had 25 years to check the data on which they’ve been spending billions of dollars. And they haven’t done so once.”
[11] NOAA’s “Requirements and Standards for [National Weather Service] Climate Observations” instructs that temperature data instruments must be “over level terrain (earth or sod) typical of the area around the station and at least 100 feet from any extensive concrete or paved surface.”
[12] Minister Hunt: “My answer was very clear: we have perhaps the best or one of the best meteorological organisations in the world. I have full confidence in their data and the idea was killed at that point,”
[13] The Road to Ruin, by Niki Savva. Scribe Publications, 2017, p135.
[14] The 2017 panel comprised Dr Ron Sandland (Chair), Emeritus Professor Bob Vincent (Vice-Chair), Dr Phillip Gould, Dr John Henstridge, Ms Susan Linacre, Professor Michael Martin, Professor Patty Solomon, and Professor Terry Speed.
[15] ACORN-SAT International Peer Review Panel Report, 2011:‘The Panel is convinced that, as the world’s first national-scale homogenised dataset of daily temperatures, the ACORNSAT dataset will be of great national and international value. We encourage the Bureau to consider the dataset an important long-term national asset.’”