https://rogerpielkejr.substack.com/p/just-the-facts-on-global-hurricanes
Note: This post is co-authored with Ryan Maue, an absolutely top notch atmospheric scientist and data wrangler. Give him a follow on Twitter: @RyanMaue and check out his tropical activity tracking page.
Back in 2012, Jessica Weinkle (@Jessica Weinkle), Ryan Maue (@RyanMaue) and I published in the Journal of Climate the first peer-reviewed paper with a comprehensive dataset of global tropical cyclone landfalls. In 2019 we shared an updated version of the data at the request of the World Meteorological Organization (WMO) as part of their assessment of tropical cyclones and climate change. That WMO assessment was heavily relied on by the most recent assessment of the Intergovernmental Panel on Climate Change.
Today we share the most recent update, with data on global hurricane landfalls from 1970 to 2022 at the global level, and going back further in time for several of the most active locations for tropical cyclone activity. You won’t find these data anywhere else.
In our 2012 paper we discussed the detection of long-term trends in landfall:
“We have identified considerable interannual variability in the frequency of global hurricane landfalls; but within the resolution of the available data, our evidence does not support the presence of significant long-period global or individual basin linear trends for minor, major, or total hurricanes within the period(s) covered by the available quality data.”
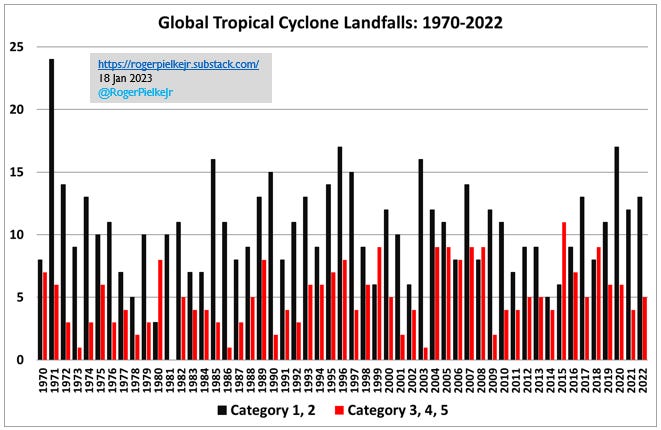
The figure below provides the latest update to Figure 2 of the original paper.

In 2022 there were 18 total landfalling tropical cyclones of at least hurricane strength around the world, of which 5 were major hurricanes. Since 1970 the median values are 16 total hurricanes, with 5 of major hurricane strength. So 2022 was very close to the median of the past half century.
Overall, based on IBTrACS best-track and preliminary data from Colorado State University since 1980, the overall number of hurricanes globally in 2022 was 86 (median = 87) and major hurricanes was 17 (median = 24). The figure below shows no long-term trends in hurricanes or major hurricanes.

If we look closely at the 12-month sums shown in the figure above we also see that the most recent 24 months has close to the least overall global activity of the past 40+ years, for both hurricanes and major hurricanes. This is not unexpected due to the ongoing triple-dip La Niña that tends to depress Pacific tropical cyclone activity while the Atlantic typically sees more frequent and intense hurricanes.
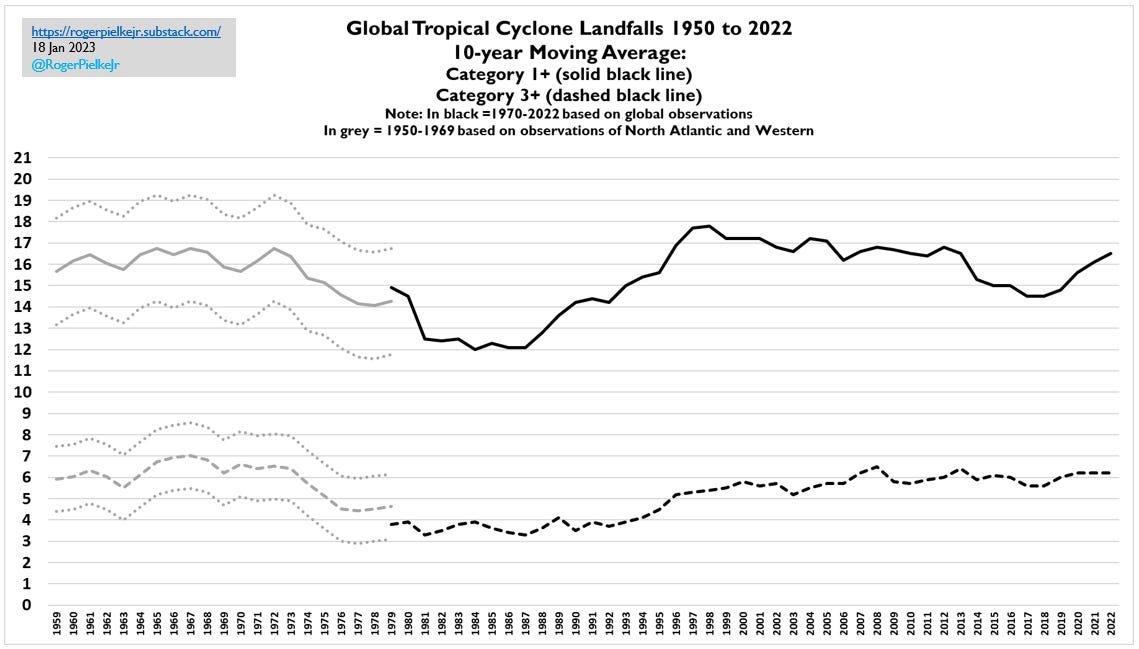
Our data also allow us to provide estimates of global landfalls going back further in time to 1950. The figure below sums:
- (a) observations from 1950 from the Western North Pacific (WPAC, where aircraft reconnaissance of tropical cyclones has taken place since 1944) and North Atlantic, together representing >70% of global hurricane landfalls
- and (b) an estimate of the landfalls from the rest of the world for 1950 to 1969 based on their statistics from 1970 to 2022.

The most striking feature of this figure is the pronounced dip in global landfalls in the 1970s and 1980s. If we look at just the landfalls in the WPAC and North Atlantic since 1945 there has been an overall sharp decline.
We have often urged caution in over-interpreting tropical cyclone time series that begin in the 1970s and 1980s because it is well understood that this period represented a low point in activity. Starting an analysis in that period invariably will result in upwards trends in tropical cyclone activity. But start the same analysis in the decades before, and those trends are muted or disappear altogether.


