Search Results for: heat death toll

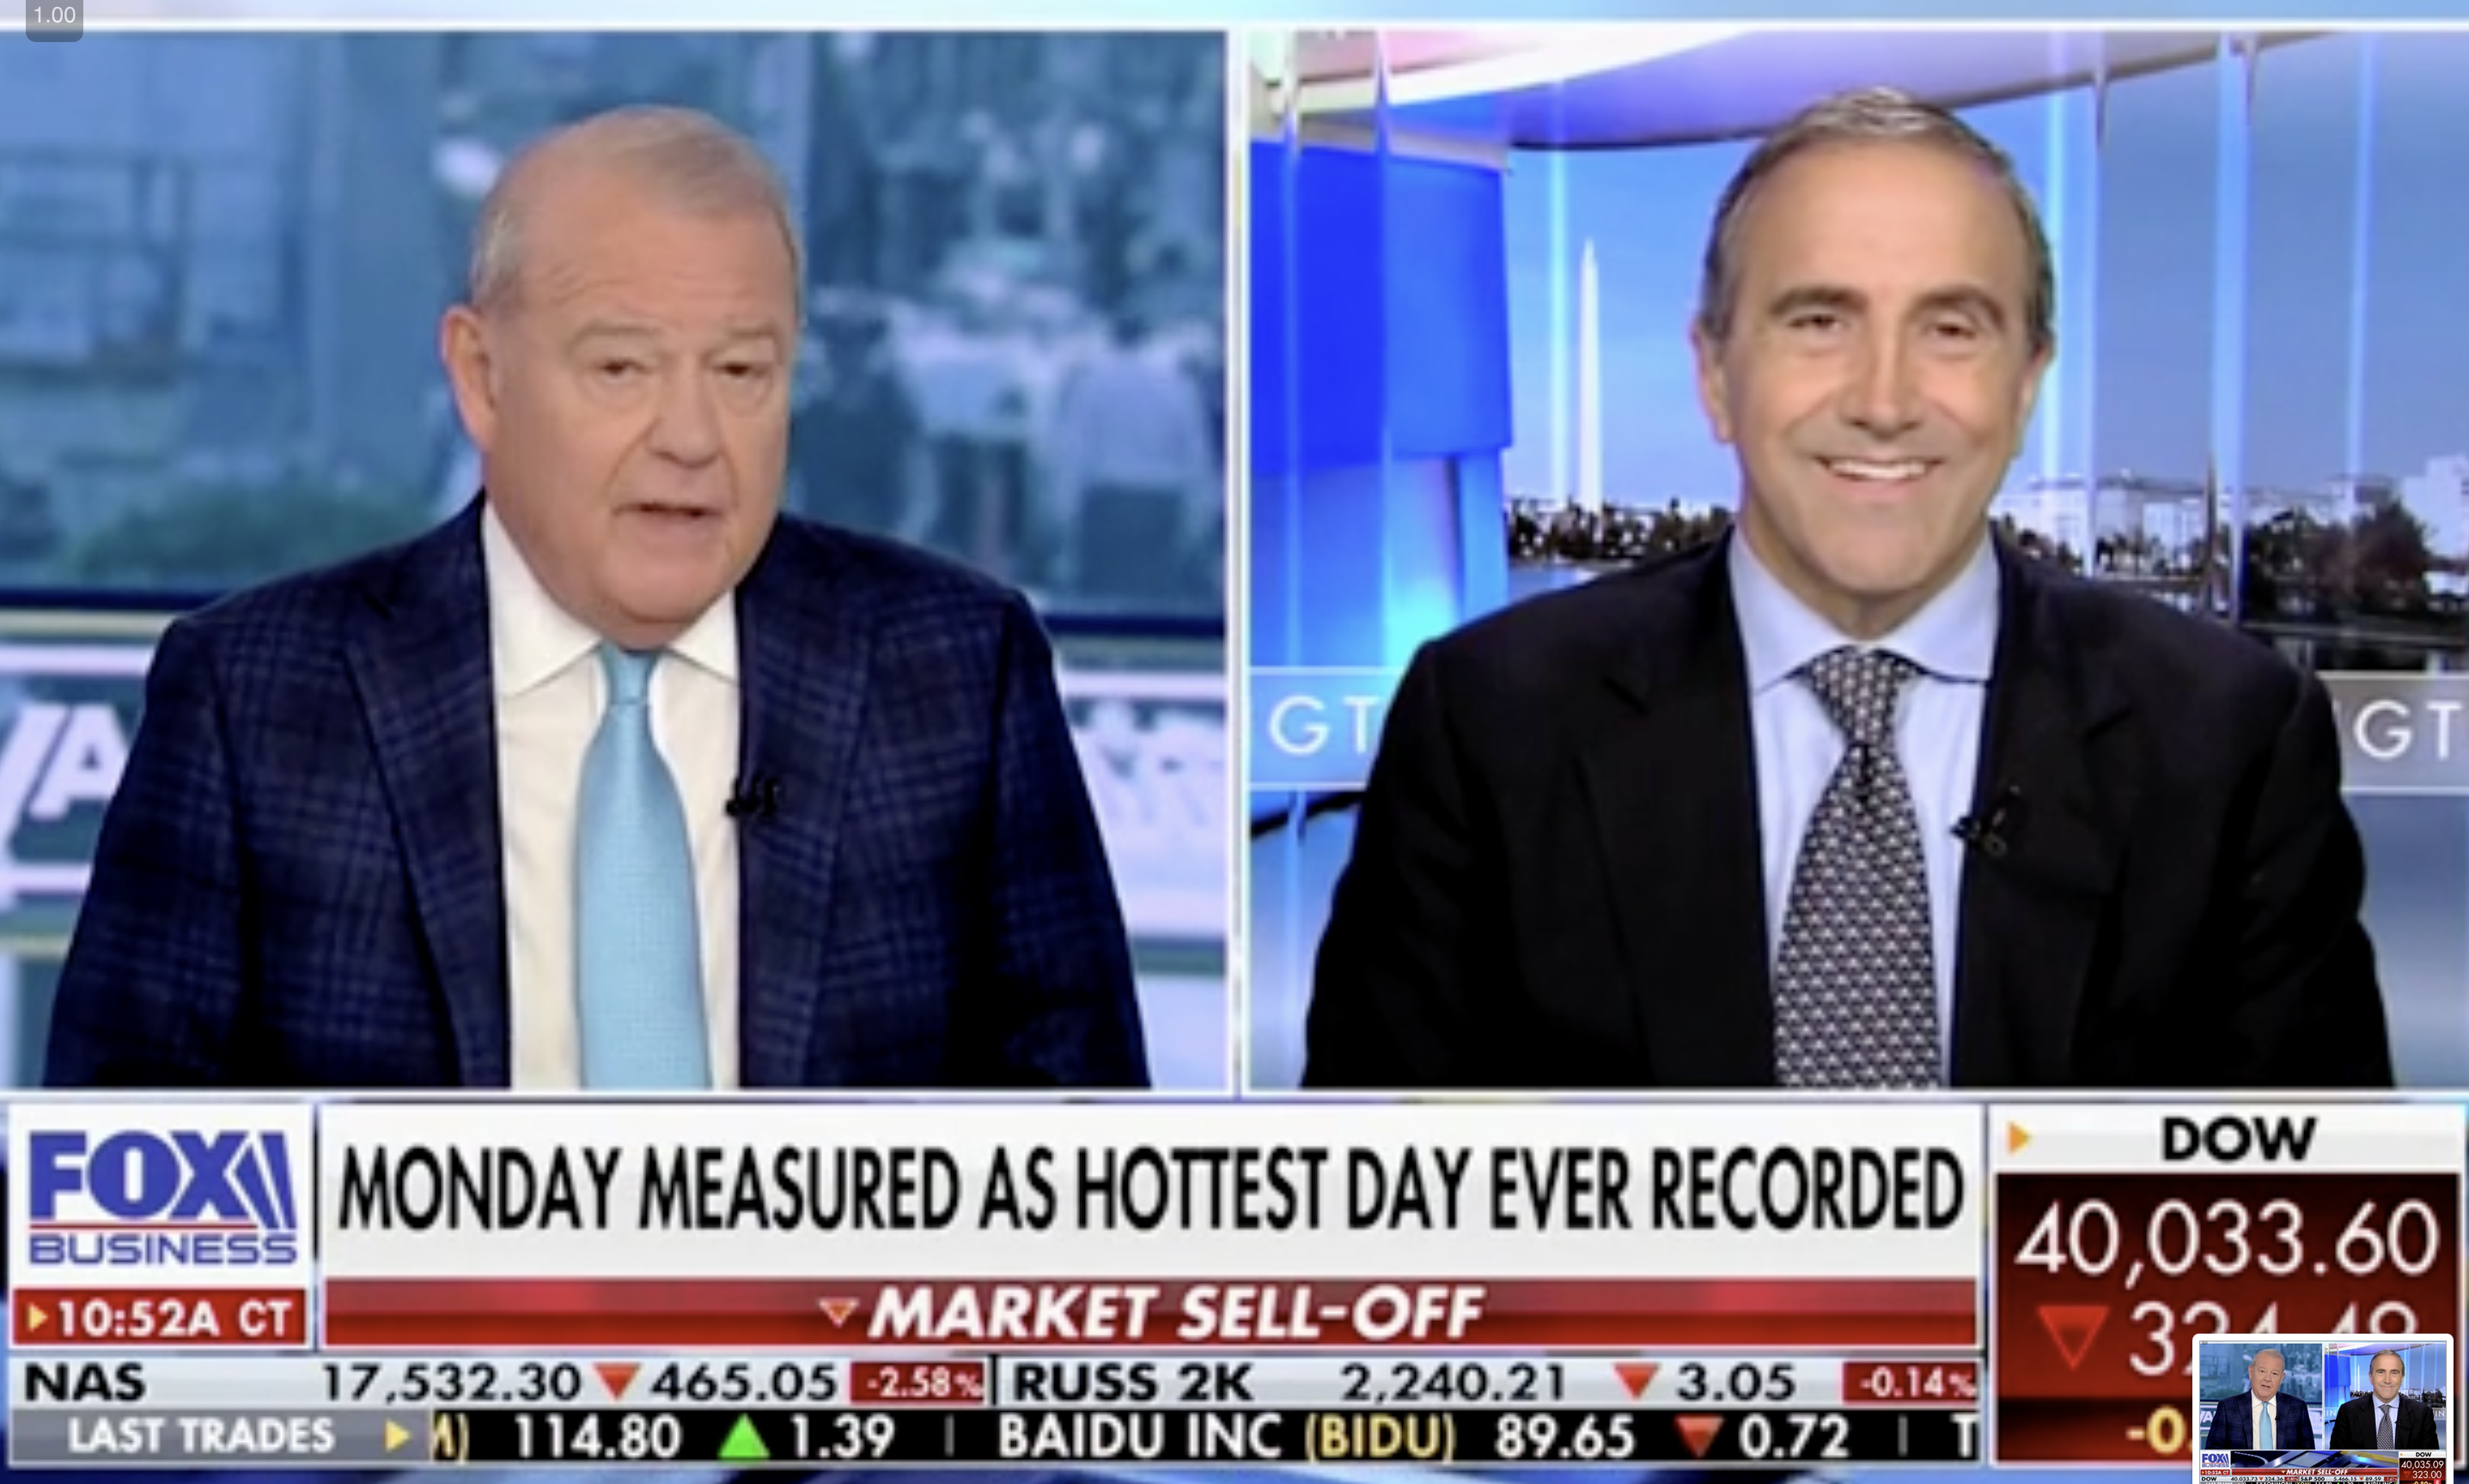
‘Statistical garbage’: Watch: Morano on Varney on Fox debunking ‘hottest day ever’ & ‘unprecedented’ heatwave claims: Based on models that ‘invent temperatures where none exist’ & ‘Biden’s EPA shows 1930s U.S. heat waves were by far much hotter’

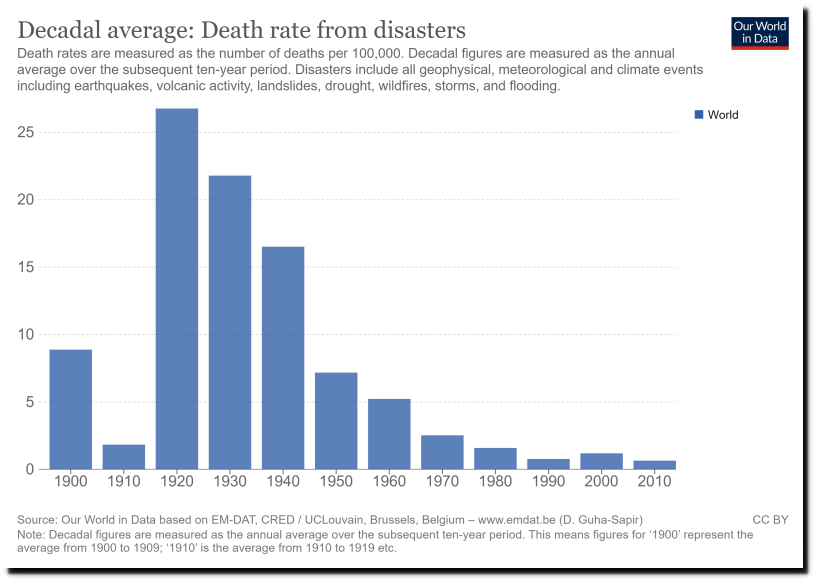
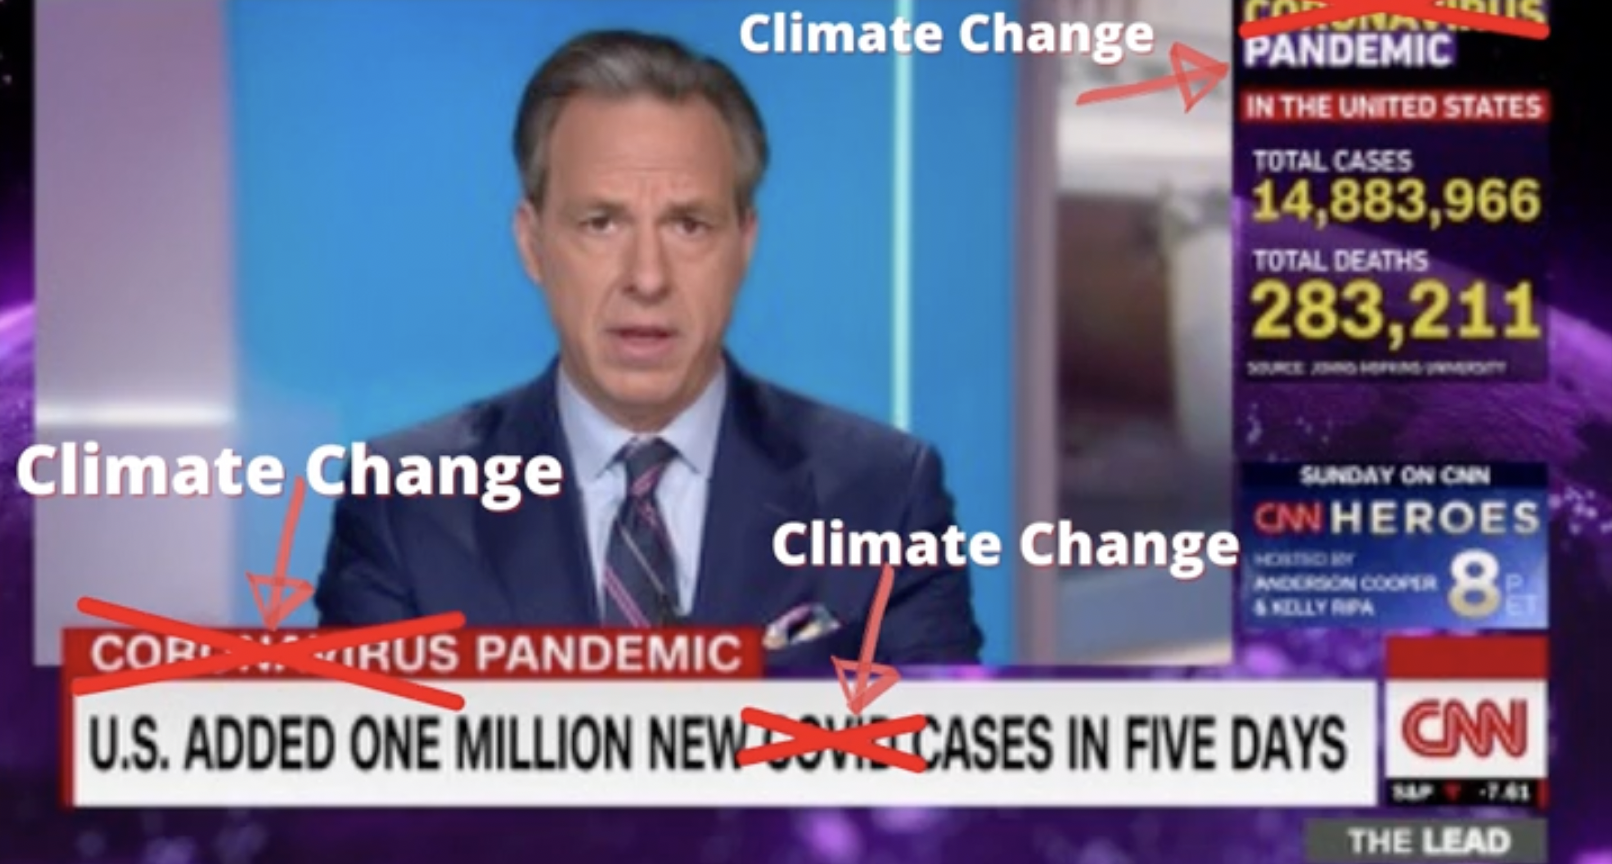
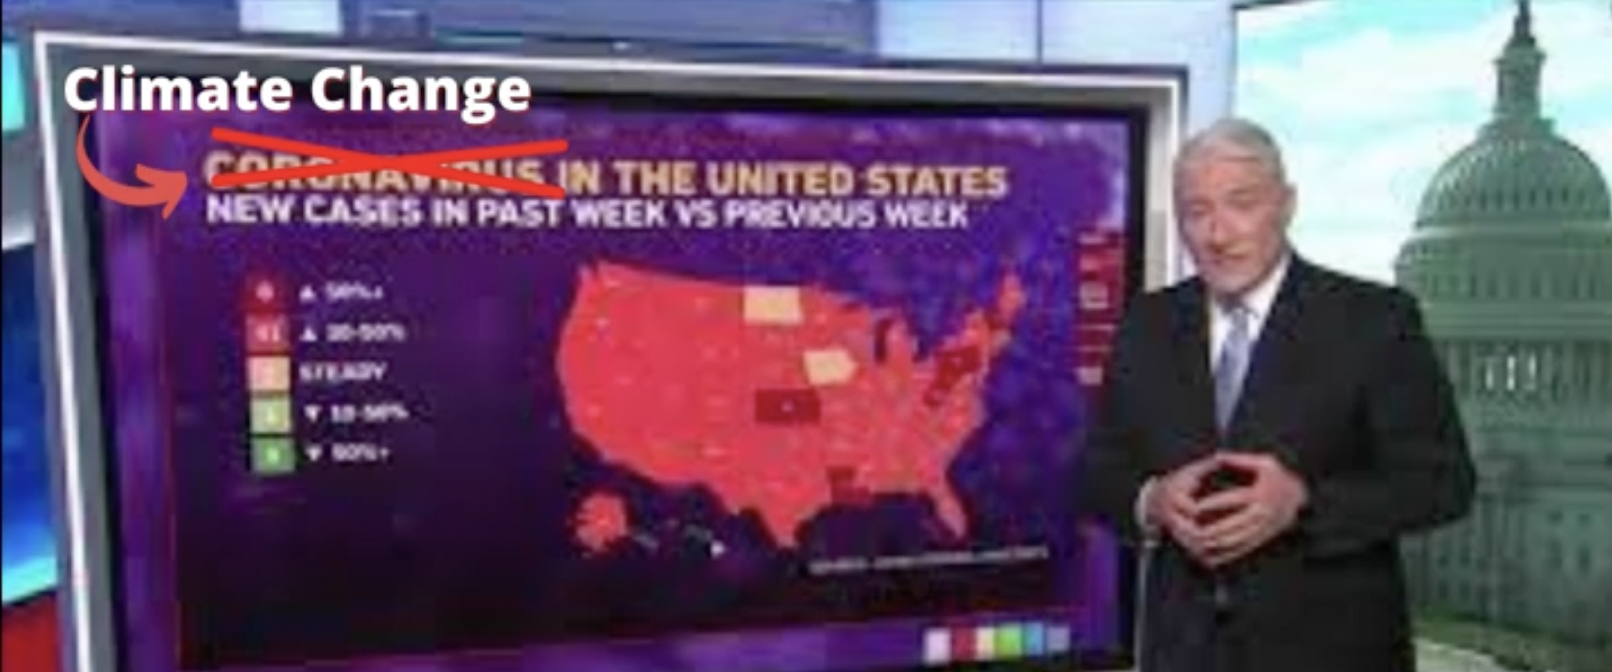
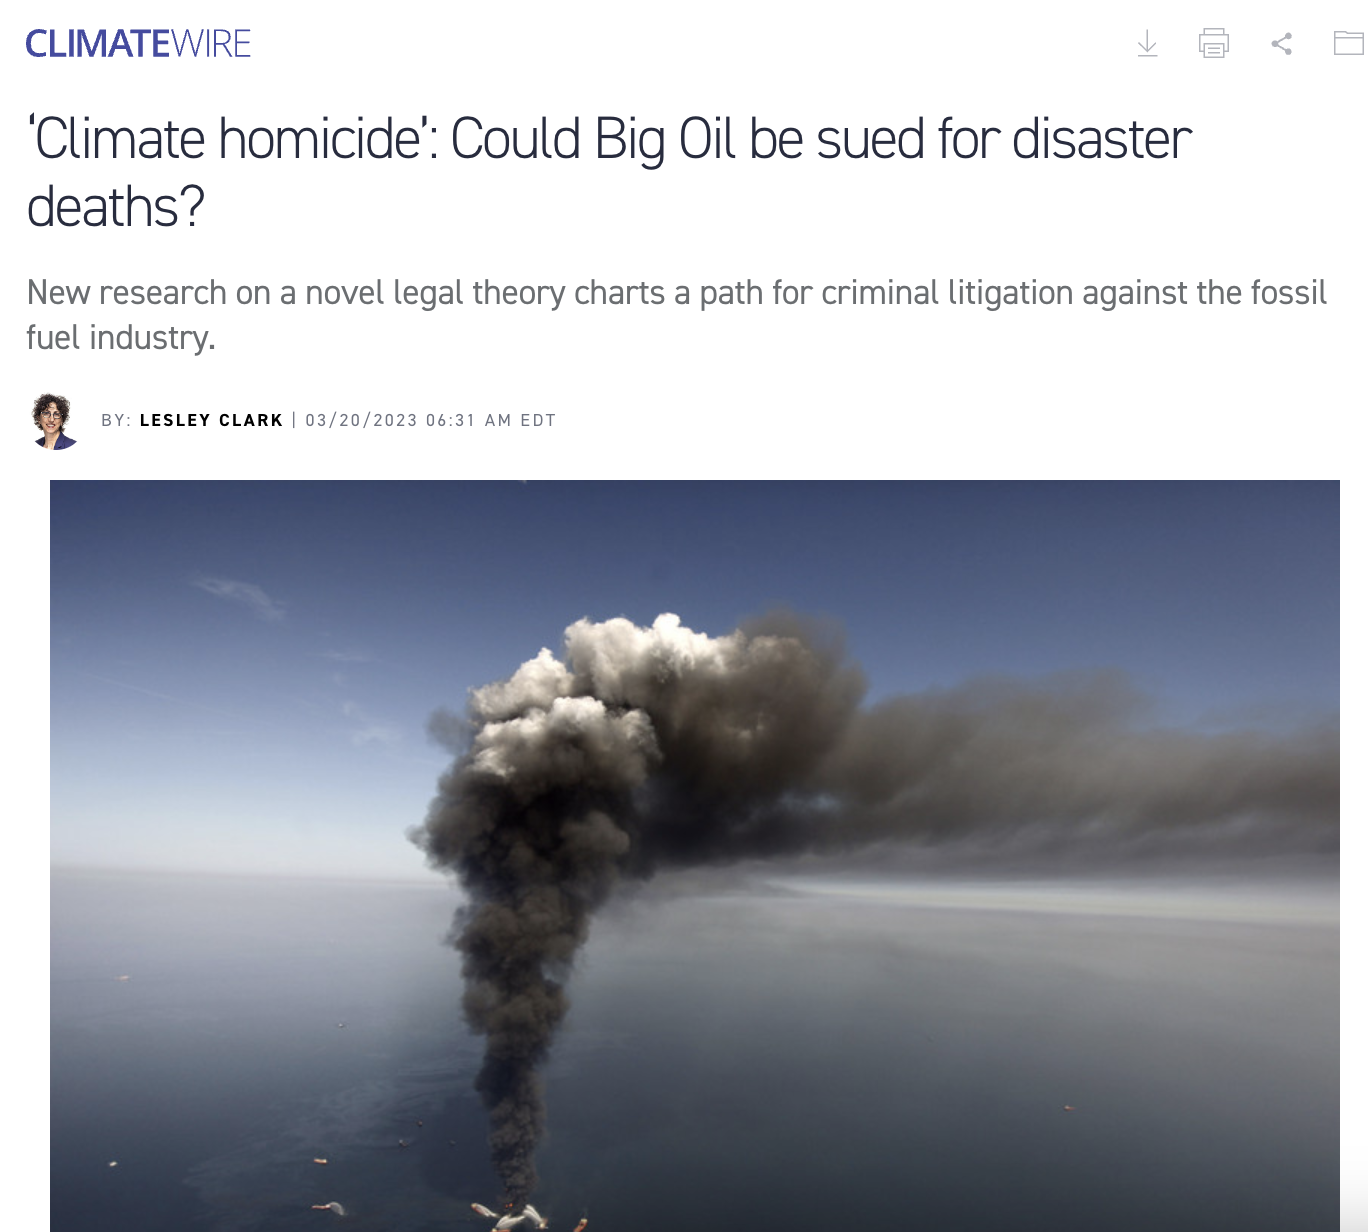
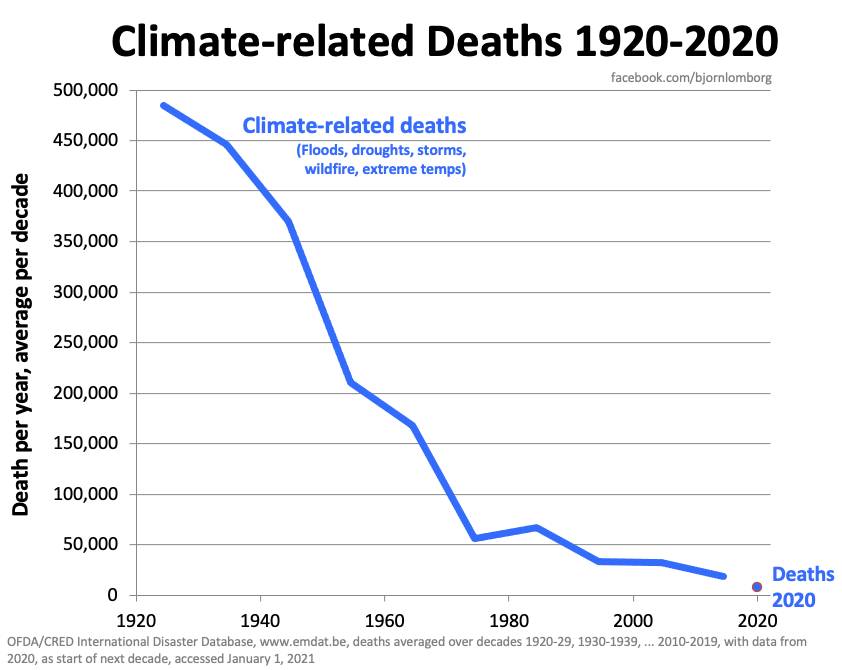
Marc Morano Appears on FBN’s ‘Varney & Company’ to Discuss Hottest Average Global Temperature – Fox Business Network – Broadcast July 24, 2024  Excerpts: Stuart Varney: Sunday was the hottest temperature ever recorded on earth — for the whole earth. The next day, Monday, the world got hotter still, with the global average temperature going to 62.87 degrees Fahrenheit. Climatedepot.com executive editor Marc Morano joining me now. The hottest day ever recorded on earth, and everybody will take this as evidence of global warming. What’s your response? Morano: “You have to understand what this is and what this means. Every year now, they’re trying to claim the ‘hottest day ever.’ Go back five to 10 years, and they used to claim the hottest year or decade. Now we’re reduced to the ‘hottest day’. Climate skeptics have been ridiculed if they suggested a cold winter or cold winter day or a snowstorm is evidence that climate change isn’t real. And now, one single day is used as evidence of man-made global warming. The Copernicus Climate Change Service admits this is a statistical analysis based on climate models and openly concedes they invent temperatures where none exist. They construct climate models, they can control all the inputs. This is statistical garbage. See: Copernicus Climate Change Service website: Morano: But even this temperature claim, which the Washington Post hypes, admits it’s indistinguishable from the previous year, hundredths of a degree difference —  which is well within the margin of error. In other words, it’s a political statement meant to get us scared that the earth is boiling. Stuart Varney: Is the world hotter now than in the 1930s? Morano: …Joe Biden’s EPA shows 1930s U.S. heat waves were by far much hotter than anything we’re experiencing today and 75, 76% of all states set their high temperature record before 1955. That gives you an idea of unprecedented heat and doesn’t hold up to NOAA data or EPA or National Climate Assessment. They know this, and this is pure hype. EPA: “Climate Change Indicators: Heat Waves” | US EPA – Figure 3: “U.S. Annual Heat Wave Index, 1895–2021”   # Background info:  The Washington Post is hyping climate for political reasons: The paper quotes activists to pile on this climate claims: “It is troubling but not surprising that we are hitting record temperatures this year,” Andrew Pershing, vice president for science at the nonprofit Climate Central, wrote in an email. “We continue to add carbon pollution to the atmosphere, so global temperatures will continue to go up.”   “We are in truly uncharted territory,” Copernicus director Carlo Buontempo said in a statement. “And as the climate keeps warming, we are bound to see records being broken in future months and years.”   Further Morano Notes on this claim:  https://climate.copernicus.eu/new-record-daily-global-average-temperature-reached-july-2024 The Copernicus Climate Change Service admits it ‘fills the gaps’ with climate models and other statistical methods, not actual temperature data. They claim it is “based on preliminary data” and was “the hottest day since at least 1940, by a small margin of 0.01ºC” which they note is “almost indistinguishable from the previous record,  reanalysis dataset.” But the media ran with it to blow out of proportion. They admit it’s a “combination of observations and state- of-the art weather and Earth system models” They tout literally invention temperatures where none exists! “We can reconstruct the past weather even for when and where we had no observations. The principle of ECMWF’s reanalyses is to provide “maps without gaps” using “data produced by model simulations in order to “fill the gaps” in observations.” What is ERA5 reanalysis: “The latest European State of the Climate, using ERA5 data, C3S stated that 2022 was the second warmest year for Europe since 1950.”  The Copernicus Climate Change Service is also beholden to Net Zero politics due to “funding” from the the European Commission. Morano: There is nothing unusual or unprecedented about the heat waves in 2024. The media and climate activists have Weaponized the heat waves to try to make us believe that they are somehow worse than ever and a result of man-made climate change. Yet the Biden administration’s own environmental protection agency reveals the simple truth. Heat waves were much, much worse in the past. The 1930s heat waves were significantly hotter than today’s. Here is the Biden/Harris EPA data: The Biden/Harris EPA data reveals U.S. heatwaves in the 1930s were significantly hotter than they are today Morano: Other Government agencies, including the National Oceanic and Atmospheric Administration and the Federal National Climate Assessments, confirm this heat wave reality as well. NOAA data reveals USA heatwaves much hotter in past: ’38/50 states or 76% recorded their high-temperature records before 1955 – 43 states measured their high temp records in or before 1985′ Morano: Yet, the media and climate activists engaging in the ‘casino effect’ to hype heatwaves.  You walk into a casino and see a wall of slot machine winners. There’s a $10,000 winner, there’s a $100,000 winner — look, that person won $300,000. And you think to yourself, ‘I’ve got to play the slots; everyone’s winning.’ It gives you the impression that everywhere, they’re paying out huge sums, and you’ve got to play slots because you’ll be a winner too. Your chances of winning the lottery are very low. The chance of someone somewhere winning the lottery is very high. Climate activists are trying to scare the public into believing that they are one heatwave away from doom and only EPA or the Green New Deal or the UN Paris climate pact can save them! Meanwhile, climate-related deaths have dropped Morano: The heatwaves are so weaponized that a former federal prosecutor wants to punish energy companies: Climate Murder: Former Federal Prosecutor calls for climate ‘2nd-degree murder prosecutions’ against ‘Big Oil’ for heat wave deaths in Arizona ‘Climate crisis’ illness?! NBC News: White House to unveil a ‘national dashboard’ for tracking ‘heat-related illnesses nationwide’ due to the ‘growing impacts of the climate crisis’ – August 10, 2023 Morano: Get ready CNN and MSNBC to pound stories like this frequently, and couple it with daily tallies of an alleged climate change ‘death toll’, all designed to spur calls for the need to take drastic ‘climate action’ to stop the deaths from our alleged ‘climate emergency. Climate Depot Reality Check: The same claims of “hottest day” were made in 2023, also based on the output of a climate model and not actually measured temperatures. See: No, the Earth Did Not have an ‘Unprecedented and Terrifying … All-Time High Temperature’ on July 4th – Not the hottest in 100,000 years – NOAA & AP back away from claim Hottest 12 Months for 125,000 Years Claim Lacks Any Scientific Evidence January 11, 2024 Chris Morrison of Daily Skeptic: Last year humanity lived through the hottest 12 months in at least 125,000 years, reported an hysterical CNN, a frame of mind replicated throughout much of the mainstream media. … Accurate temperature records barely started before the 20th century, and recent measurements by fixed thermometers have been heavily corrupted by growing urban heat. It is in fact possible using proxy measurements to get a good idea of general temperature movements over the last 125,000 years. All the evidence points to periods of much higher temperatures, notably between 10,000 to 5,000 years ago. The latest science paper examining this trend has just been published, and it points to summer temperatures at least 1.5°C higher around 5,000 years ago in the eastern Mediterranean, at a time when civilization was developing rapidly. Top climate scientists rubbish claims July was the hottest month ever – Public being ‘misinformed on a massive scale’ August 3, 2023 Via The Australian: Cliff Mass, professor of Atmospheric Sciences at University of Washington, said the public was being ‚”” misinformed on a massive scale “” It’s terrible. I think it’s a disaster. There’s a stunning amount of exaggeration and hype of extreme weather and heatwaves, and it’s very counter-productive,”” he told The Australian in an interview‚”” I’m not a contrarian. I’m pretty mainstream in a very large [academic] department, and I think most of these claims are unfounded and problematic.”” Professor Mass said the climate was ”radically warmer” around 1000 years ago during what’s known as the Medieval Warm Period when agriculture thrived in parts of now ice-covered Greenland. ‚””If you really go back far enough there were swamps near the North Pole, and the other thing to keep in mind is that we’re coming out of a cold period, a Little Ice Age from roughly 1600 to 1850.” # John Christy, a professor of Atmospheric Sciences at the University of Alabama at Huntsville, said heatwaves in the first half of the 20th century were at least as intense as those of more recent decades based on consistent, long-term weather stations going back over a century‚ “”I haven’t seen anything yet this summer that’s an all-time record for these long-term stations, 1936 still holds by far the record for the most number of stations with the hottest-ever temperatures,”” he told The Australian, referring to the year of a great heatwave in North America that killed thousands. Professor Christy said an explosion of the number of weather stations in the US and around the world had made historical comparisons difficult because some stations only went back a few years; meanwhile, creeping urbanization had subjected existing weather stations to additional heat. “”In Houston, for example, in the centre it is now between 6 and 9 degrees Fahrenheit warmer than the surrounding countryside,”” he explained in an interview with The Australian. Professor Christy, conceding a slight warming trend over the last 45 years, said July could be the warmest month on record based on global temperatures measured by satellites‚””just edging out 1998‚”” but such measures only went back to 1979. Here we go again: WaPo claims: ‘Sunday was the hottest day ever recorded on Earth, scientists say’   Six degrees of ‘hottest day ever’ hoax from WaPo @sarahkaplan48: 1. The claim that Sunday’s “global temperature” hit 62.76°F is based on modeling, not measurements. 2. Sunday’s real-time temperature measurements average out to only 56.96°F — almost 6°F cooler.… pic.twitter.com/VbcLOrS5tg — Steve Milloy (@JunkScience) July 24, 2024

Climate activists lead a ‘funeral procession’ at Citibank for causing ‘climate death’ – Mourn of all of those ‘killed’ due to the ‘climate crisis’

BREAKING: Climate activists led by @billmckibben lead a funeral procession at @Citibank to mourn of all of those killed due to the climate crisis. Citi funds death, we fight for life. @ThirdActOrg elders leading the way. pic.twitter.com/RcoQqKPya4 — New York Communities for Change (@nychange) July 8, 2024 Related:  Climate Murder: Former Federal Prosecutor calls for climate ‘2nd-degree murder prosecutions’ against ‘Big Oil’ for heat wave deaths in Arizona June 26, 2024: Public Citizen: New Memo Details Legal Case for Prosecuting Big Oil for Extreme Heat Deaths – Public Citizen press release Excerpt: … The prosecution memo … analyzes whether prosecutors in Arizona could pursue reckless manslaughter or second-degree murder prosecutions for deaths caused by the July 2023 wave, an extreme weather event that killed 403 residents of Maricopa County and that climate scientists concluded would have been “virtually impossible” but for human-caused climate change. “The case for prosecuting fossil fuel companies for climate-related deaths is strong enough for state and local prosecutors to begin initiating criminal investigations,” legal experts conclude.  Prosecutors charging major fossil fuel companies for extreme heat deaths could have a strong case, according to a new report published today by Public Citizen and former federal prosecutor Cindy Cho. …  Climate activist and author Bill McKibben said, “What’s happened to the climate is a crime: after fair warning from scientists about what would happen, Big Oil went right ahead pouring carbon into the atmosphere, and now there’s a huge pile of dead bodies (and a larger one of dead dreams). The only question left is whether our legal system will recognize these crimes—and this report shows there’s a good chance the answer could be yes.” #  You Were warned!  Climate Depot’s Marc Morano Response: “The wacky world of climate change strikes again! Blaming fossil fuel companies for ‘climate homicide’ is all part of the plan to merge public health and climate change. We have already seen a doctor diagnose the first patient in the world as suffering from ‘climate change’ in 2021.” See: B.C. doctor clinically diagnoses patient as suffering from ‘climate change’ – ‘Picked up his patient’s chart & penned in the words ‘climate change’ Flashback 2020: Calls to add ‘climate change’ to death certificates – New study demands ‘climate change’ be added as ‘pre-existing condition’  2022: Watch: Hospital staff sing & protest by featuring Death Certificates citing ‘climate change’ as cause of death: ‘Cutting down on carbon will stop our bodies droppin’ – ‘Leaders should be yearnin’ to stop the planet burnin’ Morano: “Of course, the reality is exactly the opposite. During the era of fear about ‘global warming,’ climate-related deaths have dropped dramatically, proving that mankind has adapted to climate change by using the very oil and other fossil fuels that Harvard Law now wants to charge companies with murder over!” See:After 100 years of climate change, ‘climate-related deaths’ approach zero – Dropped by over 99% since 1920 .  Get ready CNN and MSNBC to pound stories like this frequently, and couple it with daily tallies of an alleged climate change “death toll”, all designed to spur calls for the need to take drastic “climate action” to stop the deaths from our alleged “climate emergency.”   ‘Climate homicide’: Could Big Oil be sued for disaster deaths? ‘Prosecuting Big Oil for Climate Death’ urges new paper in the Harvard Environmental Law Review – March 21, 2023 Your CO2-laden breath is killing people…science says so! STUDY: ‘Three Americans create enough carbon emissions to kill one person’ – Claim: ‘For every 4,434 metric tons of CO2 produced, one person globally will die’ 2023: Just STOP Breathing! Peer-Reviewed Study Says Human Breathing ‘Contributes to Global Warming’ – Finds ‘Human respiration has a net warming effect on the atmosphere’ – Published in PLOS ONE Study published Environmental Research: Cold Weather Linked To Nearly All Temperature-Related Deaths – ‘Cold responsible for 94% of temp-related deaths’ Bjorn Lomborg: ‘Warming saves 166,000 lives each year:Heat deaths make up about 1% of global fatalities a year—almost 600,000 deaths—but cold kills eight times as many people, totaling 4.5 million deaths annually. As temperatures have risen since 2000, heat deaths have increased 0.21%, while cold deaths have dropped 0.51%. Today about 116,000 more people die from heat each year, but 283,000 fewer die from cold. Global warming now prevents more than 166,000 temperature-related fatalities annually. ‘Climate crisis’ illness?! NBC News: White House to unveil a ‘national dashboard’ for tracking ‘heat-related illnesses nationwide’ due to the ‘growing impacts of the climate crisis’ – August 10, 2023 NBC News: President Joe Biden is under increasing pressure from lawmakers and state and local officials to do more to address an extreme heat crisis that has defined the summer of 2023. … The Biden administration plans to announce on Wednesday a new federal system to track¬†heat-related illness nationwide and is considering additional measures amid pressure to do more to help Americans deal with crippling summer heat, according to White House officials. …¬† The new national dashboard, which will be overseen by the Health and Human Services Department, maps emergency services responding to heat-related illness calls across the country, officials said. The ‚ÄúEMS HeatTracker‚Äù is intended to help ensure sufficient medical aid gets to Americans who need it most during severe heat, officials said. … ‚ÄúHeat is no longer a silent killer. From coast-to-coast, communities are battling to keep people cool, safe and alive due to the growing impacts of the climate crisis,‚Äù Health and Human Services Secretary Xavier Becerra said in a statement. … One of the challenges, even if FEMA could declare a disaster for heat, would be deciding how to deploy teams to a weather event that could span dozens of states at a time and could go on for unpredictable amount of time, whereas other natural disasters are usually more limited in location and duration. #

Climate Murder: Former Federal Prosecutor calls for climate ‘2nd-degree murder prosecutions’ against ‘Big Oil’ for heat wave deaths in Arizona

June 26, 2024: Public Citizen: New Memo Details Legal Case for Prosecuting Big Oil for Extreme Heat DeathsPublic Citizen press release Excerpt: … The prosecution memo … analyzes whether prosecutors in Arizona could pursue reckless manslaughter or second-degree murder prosecutions for deaths caused by the July 2023 wave, an extreme weather event that killed 403 residents of Maricopa County and that climate scientists concluded would have been “virtually impossible” but for human-caused climate change.

“The case for prosecuting fossil fuel companies for climate-related deaths is strong enough for state and local prosecutors to begin initiating criminal investigations,” legal experts conclude.  Prosecutors charging major fossil fuel companies for extreme heat deaths could have a strong case, according to a new report published today by Public Citizen and former federal prosecutor Cindy Cho. … 

Climate activist and author Bill McKibben said, “What’s happened to the climate is a crime: after fair warning from scientists about what would happen, Big Oil went right ahead pouring carbon into the atmosphere, and now there’s a huge pile of dead bodies (and a larger one of dead dreams). The only question left is whether our legal system will recognize these crimes—and this report shows there’s a good chance the answer could be yes.”

Update: Climate activists lead a ‘funeral procession’ at Citibank for causing ‘climate death’ – Mourn of all of those ‘killed’ due to the ‘climate crisis’

You Were warned! 

Flashback 2020: Calls to add ‘climate change’ to death certificates – New study demands ‘climate change’ be added as ‘pre-existing condition’


2022: Watch: Hospital staff sing & protest by featuring Death Certificates citing ‘climate change’ as cause of death: ‘Cutting down on carbon will stop our bodies droppin’ – ‘Leaders should be yearnin’ to stop the planet burnin’

Get ready CNN and MSNBC to pound stories like this frequently, and couple it with daily tallies of an alleged climate change “death toll”, all designed to spur calls for the need to take drastic “climate action” to stop the deaths from our alleged “climate emergency.”


‘Climate homicide’: Could Big Oil be sued for disaster deaths? ‘Prosecuting Big Oil for Climate Death’ urges new paper in the Harvard Environmental Law Review – March 21, 2023

Your CO2-laden breath is killing people…science says so! STUDY: ‘Three Americans create enough carbon emissions to kill one person’ – Claim: ‘For every 4,434 metric tons of CO2 produced, one person globally will die’

2023: Just STOP Breathing! Peer-Reviewed Study Says Human Breathing ‘Contributes to Global Warming’ – Finds ‘Human respiration has a net warming effect on the atmosphere’ – Published in PLOS ONE

Study published Environmental Research: Cold Weather Linked To Nearly All Temperature-Related Deaths – ‘Cold responsible for 94% of temp-related deaths’

Bjorn Lomborg: ‘Warming saves 166,000 lives each year:Heat deaths make up about 1% of global fatalities a year—almost 600,000 deaths—but cold kills eight times as many people, totaling 4.5 million deaths annually. As temperatures have risen since 2000, heat deaths have increased 0.21%, while cold deaths have dropped 0.51%. Today about 116,000 more people die from heat each year, but 283,000 fewer die from cold. Global warming now prevents more than 166,000 temperature-related fatalities annually.

‘Climate crisis’ illness?! NBC News: White House to unveil a ‘national dashboard’ for tracking ‘heat-related illnesses nationwide’ due to the ‘growing impacts of the climate crisis’

NBC News: President Joe Biden is under increasing pressure from lawmakers and state and local officials to do more to address an extreme heat crisis that has defined the summer of 2023. … The Biden administration plans to announce on Wednesday a new federal system to track¬†heat-related illness nationwide and is considering additional measures amid pressure to do more to help Americans deal with crippling summer heat, according to White House officials. …¬†

The new national dashboard, which will be overseen by the Health and Human Services Department, maps emergency services responding to heat-related illness calls across the country, officials said. The ‚ÄúEMS HeatTracker‚Äù is intended to help ensure sufficient medical aid gets to Americans who need it most during severe heat, officials said. … ‚ÄúHeat is no longer a silent killer. From coast-to-coast, communities are battling to keep people cool, safe and alive due to the growing impacts of the climate crisis,‚Äù Health and Human Services Secretary Xavier Becerra said in a statement. …

One of the challenges, even if FEMA could declare a disaster for heat, would be deciding how to deploy teams to a weather event that could span dozens of states at a time and could go on for unpredictable amount of time, whereas other natural disasters are usually more limited in location and duration.

#

What Heatwave? Latest NOAA Data Show July Temperature in U.S. was Normal

B.C. doctor clinically diagnoses patient as suffering from ‘climate change’ – ‘Picked up his patient’s chart & penned in the words ‘climate change’

Calls to add ‘climate change’ to death certificates – New study demands ‘climate change’ be added as ‘pre-existing condition’

#
Marc Morano: “”Get ready CNN and MSNBC to pound stories like this frequently, and couple it with daily tallies of an alleged climate change ‘death toll’, all designed to spur calls for the need to take drastic ‘climate action’ to stop the deaths from our alleged ‘climate emergency.’‚Äù
  

The deadly heat wave of July 1936 in the middle of one of the hottest summers on record across the nation

https://arcfieldweather.com/blog/2023/7/13/715-am-the-deadly-heat-wave-of-july-1936-in-the-middle-of-one-of-the-hottest-summers-on-record-across-the-nation By Meteorologist Paul Dorian July is well underway and no doubt, there has been some very hot weather in recent days; especially, across the southwestern states. Despite the hot weather so far this month, July 2023 will certainly have a difficult time matching the extreme and sustained heat of July 1936. In fact, one of the most widespread and destructive heat waves ever recorded in the US took place in the summer of 1936 which fell right in the middle of arguably the hottest and driest decade ever for the nation. The decade of the 1930’s is renowned for the “Great Depression” and the “Dust Bowl”, both of which caused calamitous human suffering in this country.  Not only were huge numbers of crops destroyed by the heat and lack of moisture in the “Dust Bowl” era, but thousands of lives were lost as a result of the heat, drought and economic hardship. This extreme heat wave was particularly deadly in high population areas where air conditioning was still in the early stages of development. The heat wave experienced in 1936 began in late June, reached a peak in July, and didn’t really come to an end until September.  Many of the all-time high temperature records that were set in the 1930’s in numerous cities and states still stand today. Perhaps the hottest day ever recorded in the US took place on July 14th in 1936 when the average maximum temperature was 96°F and 70% of the US was over 90 degrees. All-time city records (left, courtesy NOAA) All-time state records (right, courtesy wunderground.com) Note – the all-time high temperature record of 111°F in Pennsylvania was actually set on both July 9th and July 10th in Phoenixville (Chester County) during this heat wave. Distribution of state all-time high temperature records on a decade-by-decade basis with the highest number in the 1930’s. Source: NOAA/NCDC The week of July 7-14 in 1936 was especially harsh across the nation with numerous sites recording temperatures of > 100 degrees (purple circles). Credit Tony Heller, Twitter. Discussion The “Dust Bowl” years of 1930-1936 brought some of the hottest summers ever to the US; especially, across the Plains, Upper Midwest and Great Lakes in arguably the hottest decade on record for the US (source 1, source 2). In addition, there were a series of droughts in this time period which ruined crops all across the Plains where, for example, lush wheat fields became unproductive waste lands.  The suffering in the “Dust Bowl” era was brought to life at the end of the decade in the book written by John Steinbeck called The Grapes of Wrath which follows the migration of a poor family of farmers from drought-stricken “Dust Bowl” farmlands to the state of California. The relentless drought across the central Plains during these “Dust Bowl” years contributed in a “positive feedback” fashion to the excessive heat by allowing the sun’s energy to be used almost exclusively in the heating of the ground and lower atmosphere without much energy loss at all in the evaporation of soil moisture. The Chicago metro region was hit particularly hard by the extreme heat in the summer of 1936, but the severity was masked by the official records kept at that time. The city’s official temperatures in 1936 were logged at the University of Chicago which was a little more than a mile from Lake Michigan. Temperatures at Midway Airport and other inland locations tell a much different story of the unprecedented heat than those reported at the official site. Credit Frank Wachowski, National Weather Service; Steve Kahn/Jennifer Kohnke, WGN-TV.   An amazing loss of life due to the widespread and destructive heat wave in July 1936 (Courtesy The Bend Bulletin newspaper (Oregon)) The worst of the extreme heat in the summer of 1936 took place during the middle part of July.  In the week that ended on July 18th, thousands of lives were lost due to the extreme heat and relentless drought conditions across the nation.  NOAA’s National Weather Service estimates that as many as 5,000 thousand lives were lost during the July 1936 heat wave. High temperatures of 100+ degrees (F) were widespread in this time period and numerous cities and states set their all-time high temperature records which still stand today (including in the Mid-Atlantic states of Pennsylvania, New Jersey and Maryland). Mrs. W.E. Johnson works her shriveled potato patch on the family farm north of Columbia, Mo., in July 1936. Only one-fourth of normal rainfall fell that summer, ruining crops and pastures. The heat wave accompanied a drought that covered much of the Midwest and Plains until scattered rainfall finally broke through on Aug. 28. (St. Louis Post-Dispatch) A few examples of the extreme heat that peaked in the Northern Plains and Upper Midwest on July 14th, 1936 included 112°F near Chicago, Illinois, 108°F in Minneapolis, Minnesota, and 110°F in Bismarck, North Dakota.  In Minneapolis, the high temperature record set on July 14th still remains today as the highest ever recorded there and the heat caused 51 deaths in St. Paul alone on that particularly deadly day. The front page of the July 13, 1936, issue of the St. Paul Daily News The Mid-Atlantic region wasn’t spared in this widespread extreme heat wave with high temperatures on July 14th of 104°F in Philly and Washington, DC.  In fact, the highest temperatures ever recorded in New York City (106°F) and Baltimore, Maryland (107°F) were set on July 10th, 1936. Even as far away as Toronto, Canada, temperatures reached 100°F and the reported death toll there for the heat wave was 225, the biggest spike in the city’s death rate since the 1918 flu pandemic. Image from the July 14, 1936 (Toronto) Evening Telegram showing “Birch Cliff” neighborhood  residents sleeping outdoors. Another newspaper headline on the deadly heat wave in mid-July (July 14, 1936) Even in the latter stages of July in 1936, there were some absolutely amazing temperature readings as the relentless extreme heat continued in many areas.  For example, a minimum temperature of 91°F was reported at Lincoln, Nebraska on the night of July 24-25 and the daily high on the 25th reached 115°F – still an all-time high temperature record. 1936 clearly stands out on these two plots of July average (left) and mean (right) temperatures across the US going back to the 1890’s (raw, measured thermometer data). It is worth noting that the “urban heat island” effect did not have the unnatural warming impact on overnight low temperatures that is experienced today in many locations.  In August of 1936, the extreme heat shifted a bit southward and four southern states set their all-time high temperature records that still stand today (Arkansas: 120°F, Oklahoma: 120°F, Texas: 120°F, and Louisiana: 116°F).  (Data Sources: Wikipedia; wunderground.com). 1936 – Year of extremes Interestingly, the exceptionally hot summer of 1936 actually followed one of the most severe cold waves in US history and some of the same regions that experienced the deadly summer heat suffered through the winter bitter cold (e.g., Northern Plains).  The climatological summer (June-August) of 1936 was the warmest nationwide on record (since 1895) with an average temperature of 74.6°F (2nd warmest summer was that of 2006 with an average of 74.4°) and July of 1936 was the single warmest month ever measured with an average of 77.4°F (beating out July 2006 by 0.1°). Ironically, February of 1936 was the coldest such on record for the month with an average nationwide temperature of 26.0°F (single coldest month on record was January 1977 with a 23.6°F average). In February of 1936 temperatures fell as low as -60°F in North Dakota, an all-time state record and Turtle Lake, North Dakota averaged -19.4°F for the entire month, the coldest average monthly temperature ever recorded in the US outside of Alaska. One town in North Dakota, Langdon, went for 41 consecutive days below zero (from January 11 to February 20), the longest stretch of below zero (including maximum temperatures) ever endured at any site in the lower 48. (Source: wunderground.com) Meteorologist Paul Dorian Arcfield arcfieldweather.com

Physicist: ‘The frequency & severity of floods, droughts, hurricanes, tornadoes, heat waves & wildfires are not increasing, & may even be declining in some cases’

https://www.scienceunderattack.com/blog/2023/5/15/no-evidence-that-extreme-weather-on-the-rise-a-look-at-the-past-1-hurricanes-129 By Physicist Dr. Ralph Alexander The popular but mistaken belief that today’s weather extremes are more common and more intense because of climate change is becoming deeply embedded in the public consciousness, thanks to a steady drumbeat of articles in the mainstream media and pronouncements by luminaries such as President Biden in the U.S., Pope Francis and the UN Secretary-General. But the belief is wrong and more a perception than reality. An abundance of scientific evidence demonstrates that the frequency and severity of floods, droughts, hurricanes, tornadoes, heat waves and wildfires are not increasing, and may even be declining in some cases. That so many people think otherwise reflects an ignorance of, or an unwillingness to look at, our past climate. Collective memories of extreme weather are short-lived. In this and subsequent posts, I’ll present examples of extreme weather over the past century or so that matched or exceeded anything we’re experiencing in the present-day world. I’ll start with hurricanes. The deadliest U.S. hurricane in record­ed history struck Galveston, Texas in 1900, killing an estimated 8,000 to 12,000 people. Lacking a protective seawall built later, the thriving port was completely flattened (photo on right) by winds of 225 km per hour (140 mph) and a storm surge exceeding 4.6 meters (15 feet). With almost no automobiles, the hapless populace could flee only on foot or by horse and buggy. Reported the Nevada Daily Mail at the time: Residents [were] crushed to death in crumbling buildings or drowned in the angry waters. Hurricanes have been a fact of life for Americans in and around the Gulf of Mexico since Galveston and before. The death toll has come down over time with improvements in planning and engineering to safeguard structures, and the development of early warning sys­tems to allow evacuation of threatened communities. Nevertheless, the frequency of North Atlantic hurricanes has been essentially unchanged since 1851, as seen in the following figure. The apparent heightened hurricane ac­tivity over the last 20 years, particularly in 2005 and 2020, simply reflects improvements in observational capabilities since 1970 and is unlikely to be a true climate trend, say a team of hurricane experts. As you can see, the incidence of major North Atlantic hurricanes in recent decades is no higher than that in the 1950s and 1960s. Ironically, the earth was actually cooling during that period, unlike today. Of notable hurricanes during the active 1950s and 1960s, the deadliest was 1963’s Hurricane Flora that cost nearly as many lives as the Galveston Hurricane. Flora didn’t strike the U.S. but made successive landfalls in Tobago, Haiti and Cuba (path shown in photo on left), reaching peak wind speeds of 320 km per hour (200 mph). In Haiti a record 1,450 mm (57 inches) of rain fell – comparable to what Hurricane Harvey dumped on Houston in 2017 – resulting in landslides which buried whole towns and destroyed crops. Even heavier rain, up to 2,550 mm (100 inches), devastated Cuba and 50,000 people were evacuated from the island, according to the Sydney Morning Herald. Hurricane Diane in 1955 walloped the North Carolina coast, then moved north through Virginia and Pennsylvania before ending its life as a tropical storm off the coast of New England. Although its winds had dropped from 190 km per hour (120 mph) to less than 55 km per hour (35 mph) by then, it spawned rainfall of 50 cm (20 inches) over a two-day period there, causing massive flooding and dam failures (photo to right). An estimated total of 200 people died. In North Carolina, Diane was but one of three hurricanes that struck the coast in just two successive months that year. In 1960, Hurricane Donna moved through Florida with peak wind speeds of 285 km per hour (175 mph) after pummeling the Bahamas and Puerto Rico. A storm surge of up to 4 meters (13 feet) combined with heavy rainfall caused extensive flooding all across the peninsula (photo on left). On leaving Florida, Donna struck North Carolina, still as a Category 3 hurricane (top wind speed 180 km per hour or 110 mph), and finally Long Island and New England. NOAA (the U.S. National Oceanic and Atmospheric Administration) calls Donna “one of the all-time great hurricanes.” Florida has been a favorite target of hurricanes for more than a century. The next figure depicts the frequency by decade of all Florida landfalling hurricanes and major hurricanes (Category 3, 4 or 5) since the 1850s. While major Florida hurricanes show no trend over 170 years, the trend in hurricanes overall is downward – even in a warming world. Hurricane Camille in 1969 first made landfall in Cuba, leaving 20,000 people homeless. It then picked up speed, smashing into Mississippi as a Category 5 hurricane with wind speeds of approximately 300 km per hour (185 mph); the exact speed is unknown because the hurricane’s impact destroyed all measuring instruments. Camille generated waves in the Gulf of Mexico over 21 meters (70 feet) high, beaching two ships (photo on right), and caused the Mississippi River to flow backwards. A total of 257 people lost their lives, the Montreal Gazette reporting that workers found: a ton of bodies … in trees, under roofs, in bushes, everywhere. These are just a handful of hurricanes from our past, all as massive and deadly as last year’s Category 5 Hurricane Ian which deluged Florida with a storm surge as high as Galveston’s and rainfall up to 685 mm (27 inches); 156 were killed. Hurricanes are not on the rise today.

We have to get rid of the 1930s EPA heatwave records! Warmist Prof. Andrew Dessler tries to erase 1930s heatwaves – Seeks to ‘change’ definition of heatwave

Climate Activist Professor Dessler seeks to eliminate record-breaking 1930s EPA heatwave chart https://notalotofpeopleknowthat.wordpress.com/2022/06/22/no-andy-epa-are-not-cherry-picking/ No Andy, EPA Are Not Cherry Picking By Paul Homewood Andy “Don’t Believe The Data” Dessler claims that the EPA heatwave index is cherry-picked, because it is based on 90th percentiles:   https://twitter.com/AndrewDessler/status/1429099366250434562?s=20&t=jbrp-SxXqW7qPBDy9FK5CQ He prefers 95% percentiles, which he claims are not cherry-picking!   Only one slight problem, Andy! The EPA have also looked at 95%, and come to the same conclusions as before; there has been a marked decline in heatwaves for most of the US: https://www.epa.gov/climate-indicators/climate-change-indicators-high-and-low-temperatures Note that the trend is measured from 1948, so the extreme heat of the 1930s is not even reflected here. There is one other consideration here. Dessler has also used Berkeley Earth homogenised dataset (BEST). His calculations indicate just how divorced from reality BEST is, with temperatures far above what the actual data suggest. Finally, let’s look back to the graph for Texas, which I showed in my earlier post: Note that the average of “hot days” is 20 a year – in other words, 95% percentile to all intents and purposes. On all counts, Dessler’s own analysis is fake.   https://notalotofpeopleknowthat.wordpress.com/2022/06/22/who-needs-facts-andy/ Who Needs Facts, Andy? By Paul Homewood So this is what climate science has sunk to! https://twitter.com/AndrewDessler/status/1429099366250434562?s=20&t=jbrp-SxXqW7qPBDy9FK5CQ   Andrew Dessler is Professor of Atmospheric Sciences & climate “scientist” at Texas A&M. There was time when science was about facts and truths. Now it seems that climate science is not interested in data but feelings. The chart he disparages has been used as a long-term indicator of US heatwaves for several years by the EPA. Moreover, it tallies with other official charts published in the National Climate Assessment in 2017: Heat waves (6-day periods with a maximum temperature above the 90th percentile for 1961–1990) increased in frequency until the mid-1930s, became considerably less common through the mid-1960s, and increased in frequency again thereafter (Figure 6.4). As with warm daily temperatures, heat wave magnitude reached a maximum in the 1930s https://science2017.globalchange.gov/chapter/6/ The vast majority of State record high temperatures were set in the 1930s, notable 1936: We can also drill down to individual States, such as Dessler’s own Texas: https://statesummaries.ncics.org/chapter/tx/ And his own part of Texas:   http://climod2.nrcc.cornell.edu/ But hey Andy, who needs facts? # https://realclimatescience.com/2022/06/dessler-wants-to-erase-the-1930s/ Dessler Erases The 1930s by tonyheller 9:13 AM · Aug 21, 2021 National Climate Assessment “the warmest daily temperature of the year increased in some parts of the West over the past century (Figure 6.3), but there were decreases in almost all locations east of the Rocky Mountains. In fact, all eastern regions experienced a net decrease (Table 6.2), most notably the Midwest (about 2.2°F [1.2°C]) and the Southeast (roughly 1.5°F [0.8°C]). The decreases in the eastern half of Nation, particularly in the Great Plains, are mainly tied to the unprecedented summer heat of the 1930s Dust Bowl era”   Temperature Changes in the United States – Climate Science Special Report National Report on Sustainable Forests — 2010 TimesMachine: October 9, 1938 – NYTimes.com Twenty-four states set their temperature record during the 1930s. Record Highest Temperatures by State psi-193407.gif (690×488) 1934 and 1936 were unprecedented years for heat and drought in US. But the extreme weather wasn’t just in the US – it was global.  Click on the 1934 LA Times below to see it full sized. 30 Dec 1934, Page 13 – The Los Angeles Times at Newspapers.com   During 1934, the world experienced unprecedented drought and heat. 22 Jun 1934, Page 3 – Hartford Courant at Newspapers.com THE CAIRNS POST, SATURDAY,” FEBRUARY 3, 1934. “WORLD HEATING UP.” ‘ICE DISSOLVING AT POLES.’’ ‘‘SEA WILL RISE 40 PEET.’’ The world is gradually becoming both warmer and drier. One day the great Polar icecaps may melt—raising the level of the oceans from 40 to 50 feet, and wiping half of England from the map.” 03 Feb 1934 – “WORLD HEATING UP.” – Trove 22 Jun 1934 – EARTH GROWING WARMER – Trove 04 Jun 1934 – WORLD DROUGHT – Trove 19 Jul 1934 – DROUGHT IN ENGLAND. – Trove 04 Jan 1934 – DROUGHT MAY HELP RESEARCH – Trove 03 Jan 1934 – GRIPPED BY DROUGHT – Trove 25 May 1934 – DROUGHT IN S.A. – Trove 31 May 1934 – CROP FAILURES IN RUSSIA – Trove 500,000 STARVING IN CHINA’S DROUGHT- The New York Times 07 Jun 1934 – LONDON’S WORST DROUGHT IN 180 YEARS – Trove 31 May 1934 – [?] WAVE. WHOLE WORLD AFFECTED. – Trove 07 Jun 1934 – ANTARCTIC HEAT WAVE. – Trove The Southeast Missourian – Google News Archive Search Gettysburg Times – Google News Archive Search 12 May 1934, 13 – The Guardian at Newspapers.com 19 Jan 1934, Page 10 – The Sydney Morning Herald at Newspapers.com 05 Jun 1934, Page 5 – The News-Chronicle at Newspapers.com 26 Sep 1934 – Toll of Typhoon 2,500 Dead – Trove 29 Sep 1934 – JAPANESE TYPHOON. – Trove 24 Sep 1934 – JAPANESE TYPHOON – Trove July, 1936 was the hottest month on record in the US. Wayback Machine The Bulletin – Google News Archive Search TimesMachine: July 7, 1936 – NYTimes.com 16 Jul 1936 – WORST DROUGHT IN HISTORY – Trove 11 Jul 1936, 1 – Chicago Tribune at Newspapers.com The hottest temperature ever recorded in New York City (106F) occurred on July 9, 1936.   21 Jul 1936 – DEATHS IN CANADA – Trove Page 1 – Carroll Daily Herald at Newspapers.com Texas A&M Shut Down a Major Climate Change Modeling Center in February After a ‘Default’ by Its Chinese Partner – Inside Climate News # Flashback 2006: David Deming testifies to U.S. Senate: ‘I had another interesting experience around the time my paper in Science was published. I received an astonishing email from a major researcher in the area of climate change. He said, ‘We have to get rid of the Medieval Warm Period.’ https://www.climatedepot.com/2014/01/18/geologist-dr-david-deming-if-the-current-cooling-trend-continues-the-theory-of-global-warming-faces-imminent-extinction/

Record Summer Chills sweep the U.U., as Sub-Polar Cold hits Africa–threatening ‘an Acute Maize Shortage’ – Northwest’s heatwave is the anomaly here, not the norm.

https://electroverse.net/record-summer-chills-sweep-the-us-as-sub-polar-cold-hits-africa/ Record Summer Chills sweep the United States, as Sub-Polar Cold hits Africa–threatening “an Acute Maize Shortage”Electroverse / by Cap Allon / 7hIt’s setting up to be a historically cool summer across much of the CONUS, particularly for the Midwest and the South, including states such as Texas, New Mexico, Oklahoma and Kansas… among many others. The Pacific Northwest’s heatwave is the anomaly here, not the norm. Vast swathes of the United States have been holding unusually-cool for the majority of 2021 — the nation as a whole suffered its coldest February since 1989, while Texas’ “big freeze” that month resulted in a deathtoll of 702 with reports of people freezing to death in their beds. And even now, with mid-summer fast-approaching, two-thirds of the CONUS is still holding below average. In fact, record summer chills are threatening to descend from the Arctic, as a mass of polar air rides anomalously-far south on the back of a low solar activity-induced “meridional” jet stream flow. Looking at the latest GFS run (shown below), temperature departures some 16-20C below the seasonal average will continue to sweep central and southern regions as the month of July progresses. Here’s the temperature outlook for Wednesday, July 14: GFS 2m Temp Anomalies (C) for July 14 [tropicaltidbits.com]. And here’s Thursday, July 15: GFS 2m Temp Anomalies (C) for July 15 [tropicaltidbits.com]. Eyeing further ahead, these potentially record-setting lows are forecast to persist into late-July. Below is Tuesday, July 20: GFS 2m Temp Anomalies (C) for July 20 [tropicaltidbits.com]. And here is Wednesday, July 21–where some exceptional negative anomalies are forecast for central Texas: GFS 2m Temp Anomalies (C) for July 21 [tropicaltidbits.com].As it stands, states like Texas are on for something of a ‘year without a summer’. Also, and mercifully, the heat in the west looks set to soon subside. Escaping the MSM’s attention though –and during the peak of the Pacific Northwest’s “catastrophic” heatwave– San Francisco actually neared historic low temperatures for July. The city logged a daily max of just 58F (14.4C) on Sunday, July 11 — this reading was just a few degrees off the coldest-ever high on record for San Francisco in the month of July, and was its lowest-maximum since the 57F (13.9F) observed almost a decade ago (during the solar minimum of cycle 24). The difference in temperatures between inland regions and a coastal city like San Francisco is a testament to the marine layer’s impact on the city, explained Roger Gass, a meteorologist with the National Weather Service (NWS). Composed of clouds that shield sunlight and heat, San Francisco’s marine layer is responsible for keeping the city free of dangerous heat wave conditions. “Essentially things are working the way they’re supposed to work as far as the marine influences keeping the coast cooler,” said Gass. Despite MSM lies and exaggerations, Earth’s Average Temperature Fell BELOW the 30-Year Baseline in June Africa Maize Concerns following Cold and DroughtThe Kenyan government has warned of “an acute maize shortage” in the coming year due to reduced rainfall and unusually cold temperatures. Maize is a staple food for most households, and its availability depends on weather patterns during planting. John Kamanja, a senior officer from the Ministry of Agriculture, said many farmers planted late this year as they waited for the rains, but then anomalous-cold set in earlier than expected, in May, rather than during the expected month of July. An intense, early-season chill has been “Ravaging” East Africa’s Crops “I am not sure I will get anything much from my 25 acres under maize this season,” said Sammy Chemweno, a grower based in Moiben, Uasin Gishu County. Chemweno estimates his production will drop from 25 bags of maize per acre to less than 10. “The future looks bleak,” he continued. “The last time we witnessed this kind of a situation was 2009″ (during the solar minimum of cycle 24). “There will be a maize shortage this season,” warned Kamanja. Namibia FreezesNamibia’s Meteorological Service has warned citizens to take the necessary precautions to “shield themselves” against “very cold conditions expected to hit during the course of this week”. According to meteorologist Odillo Kgobetsi, these extreme lows are due to the arrival of a powerful polar front kicked up from an anomalously-cold Antarctica–which is currently holding some 4.2C below the 1979-2000 norm. Antarctic Sea Ice Extent largest since 2015, and GROWING Extreme cold is expected in the south, central and eastern regions — with rare and heavy frosts setting in. “Small stock and crop farmers should take the necessary precautions,” warned Kgobetsi, who expects lows of -3C (26.6F) in Gobabis, -2C (28.4F) at Rehoboth, Buitepos, and Windhoek, and 0C (32F) at Aroab. Heavy Snow Hits South AfricaThe same Antarctic air mass currently engulfing Namibia first swept South Africa, where it is still lingering. Snowfall has been recorded over the Northern Cape, and in Sutherland. Flakes have also settled in the Matroosberg Private Nature Reserve–located two hours outside Cape Town. And a total of four mountain passes have been shut due to substantial flurries in the Eastern Cape, reports sabcnews.com, with the Eastern Cape Transport Department urging motorists to avoid all roads in high lying areas. @SAWeatherServic @StormReportSA1 Rhodes, Eastern Cape this morning pic.twitter.com/mdk9dZMCp3 — Theuns Jonck (@TheunsJonck) July 13, 2021 The South African Weather Service has warned of further freezing temperatures across large parts of the country from Tuesday onward, with record-challenging lows on the cards for Wednesday. The cold has already infected parts of the interior, including in cities like Johannesburg and Pretoria. While “alerts” have been issued for regions such as Guateng: ALERT: WORST COLD SNAP SO FAR IN 2021 expected in GAUTENG FROM TUESDAY, as BLISTERING SUB-POLAR AIR from JUST NORTH of ANTARCTICA LASHES SOUTH AFRICA!!! — Gauteng Weather (@tWeatherSA) July 11, 2021 The COLD TIMES are returning, the mid-latitudes are REFREEZING, in line with the great conjunction, historically low solar activity, cloud-nucleating Cosmic Rays, and a meridional jet stream flow (among other forcings). Both NOAA and NASA appear to agree, if you read between the lines, with NOAA saying we’re entering a ‘full-blown’ Grand Solar Minimum in the late-2020s, and NASA seeing this upcoming solar cycle (25) as “the weakest of the past 200 years”, with the agency correlating previous solar shutdowns to prolonged periods of global cooling here. Furthermore, we can’t ignore the slew of new scientific papers stating the immense impact The Beaufort Gyre could have on the Gulf Stream, and therefore the climate overall. Prepare accordingly— learn the facts, relocate if need be, and grow your own. Social Media channels are restricting Electroverse’s reach: Twitter are purging followers while Facebook are labeling posts as “false” and have slapped-on crippling page restrictions. So, be sure to subscribe to receive new post notifications by email (the box is located in the sidebar >>> or scroll down if on mobile). Please also consider disabling ad blockers for electroverse.net, if you use one. And/or become a Patron, by clicking here: patreon.com/join/electroverse. The site receives ZERO funding, and never has. So any way you can, help us spread the message so others can survive and thrive in the coming times. Grand Solar Minimum + Pole Shift The post Record Summer Chills sweep the United States, as Sub-Polar Cold hits Africa–threatening “an Acute Maize Shortage” appeared first on Electroverse. SHAREVISIT WEBSITE

Air pollution death toll claims just blowing smoke: ‘Computer model claimed more people died from air pollution than died in the real world from all causes’

https://notalotofpeopleknowthat.wordpress.com/2017/04/10/ross-mckittrick-on-air-pollution/ Air pollution death toll claims just blowing smokeNOT A LOT OF PEOPLE KNOW THAT / by Paul Homewood / 2d By Paul Homewood http://www.therecord.com/opinion-story/2577751-air-pollution-death-toll-claims-just-blowing-smoke/ I mentioned Ross McKittrick’s air pollution study earlier. This is the full report on it from The Record: Anyone tossing around allegations that a “crime” has been committed had better be prepared to defend those claims with solid evidence. Two weeks ago on these pages local entrepreneur Derek Satnik made such a claim. In defending the viability of wind power Satnik, who works in the green energy industry, warned readers that they must consider the deadly impact of other forms of electricity. (“Does any potential health risk from wind power even matter? March 26, 2011) Satnik writes: “The chief medical officer of Ontario publishes annual reports that talk about the 9,000 Ontarians who die every year from respiratory aliments caused in part by the emissions from coal based electricity plants.” He claims anyone who uses electricity is somehow “involved” in this devastating annual death toll. “It’s a crime that we’ve gone so long thinking it’s OK for anyone to turn on their fridge without thinking of who dies at the other end of the wires.” It seems a damning argument. If true. So where is the provincial government’s list of coal-fired deaths? I phoned the chief medical officer of Ontario in Toronto and was told her office has never produced any reports on respiratory deaths due to electricity or air pollution. Hmm. However, the Ontario Medical Association – a non-government organization that represents doctors – did produce a report in 2008 on the death toll resulting from air pollution. While it does not explicitly finger coal power as the culprit, it’s possible Satnik just made a sloppy reference. Then again, over 9,000 deaths a year is a massive loss of life. A closer look at the original source material is necessary. The Ontario Medical Association’s Illness Costs of Air Pollution report states that “air pollution is a contributing factor in almost 9,500 premature deaths per year in Ontario.” It then provides a surprisingly detailed account of these fatalities. In Waterloo Region exactly 348 deaths were caused by air pollution. In Guelph and environs, the toll was 158. Hamilton: 445. Toronto: 2,130. But there is something absurd about the precision with which the doctors’ organization claims to have identified death by smog. Air pollution never shows up as a cause on a death certificate. So how can anyone be sure of these numbers? In fact not all doctors agree with the outlandish claims. Last year I asked Cambridge family physician Paul Cary about the smog deaths attributed to our region. He called it “quite ludicrous. In 40 years of medicine I have never once seen or heard of a patient struck down by air pollution.” While smog alerts can be associated with mass hospitalizations and an increase in deaths, Cary explains this is a spurious link. Heat-exhaustion and fluid loss are the real culprits, not pollution. The numbers for smog deaths do not come from any tangible real world evidence, but have been inferred using computer models. The Ontario Medical Association combines hospitalization and death rates, air quality readings and various other factors to create a guess at how many fatalities are due to air pollution. This includes short-term impacts arising from smog alerts as well as longer-term effects. Toronto Public Health uses the same technique to conclude that 1,700 residents die annually from air pollution. But computer modeling of this kind is a highly subjective exercise. It is necessary to apply some common sense to the results. Ross McKitrick, a University of Guelph economist, has taken a close look at the usefulness of the computer methods producing these smog death figures. First he took Toronto’s computer model and gave it data from the 1960s, when air pollution was noticeably worse than today. Back-testing is a common way to judge a computer model’s reliability. If it cannot explain what has already happened, then it’s usefulness in explaining the future is highly suspect. The output was nonsense. In February 1965, for instance, the computer model claimed more people died from air pollution than died in the real world from all causes. “The results I got suggest the models are implausible,” McKitrick told me. “They’re attributing over 100 percent of all deaths to air pollution. It just doesn’t make sense.” Given the obvious flaws in existing computer models, McKitrick created his own simulation. With two Scottish academics he gathered 20 years of data from five Canadian cities – a far larger data set than used by the Ontario Medical Association – and performed a more sophisticated computer test. These results show air pollution to be almost entirely irrelevant to hospital admissions or death. Smoking and income are the most significant factors in explaining respiratory ailments. “We can find no evidence that air pollution levels observed from 1974 to 1994 had a detrimental effect on either excess hospital admissions or time spent in hospital,” concludes the report in the academic journal Environmental Modelling & Software. According to McKitrick, even if all forms of air pollution miraculously disappeared from Ontario over night, there would be no noticeable decline in the death rate. Claims of a massive death toll do not stand up to scrutiny. Fans of wind power can blow all they like, but 9,000 people do not die every year because of coal-fired electricity. http://www.therecord.com/opinion-story/2577751-air-pollution-death-toll-claims-just-blowing-smoke/   I have also come across a couple of tables from the ONS, which throw a bit more light on the matter:   The first shows how death rates from asthma used to be much greater in the 1960s:   https://www.ons.gov.uk/peoplepopulationandcommunity/healthandsocialcare/causesofdeath/adhocs/005593agespecificmortalityrateswheretheunderlyingcauseofdeathwasasthmaenglandandwales19601966and2014     The second concerns deaths from respiratory disease in London between 2001 and 2015 (I have blown up the total column for ease of reading). This shows a steady decline:   https://www.ons.gov.uk/peoplepopulationandcommunity/birthsdeathsandmarriages/deaths/adhocs/006831monthlyrespiratorydeathsinlondon2001to2015   When looking at respiratory diseases, it is worth noting that the vast majority of such deaths occur amongst elderly people. For instance, the ONS report that there were 8600 excess winter deaths due to respiratory disease in 2015/16. Of these 3600 were from the 85+ age group, and a further 2600 amongst 75 to 84 year olds. It is a harsh fact that we all have to die from something, and when you get to 80, it is quite likely that respiratory disease will get you. As more and more people live to that sort of age, it is inevitable that, all else being equal, respiratory disease will account for more deaths.    

Lancet’s Heat-Related Deaths Con Trick: ‘Lancet conveniently forget to mention that cold kills far more people than warmth does’

https://notalotofpeopleknowthat.wordpress.com/2020/12/04/lancets-heat-related-deaths-con-trick/ By Paul Homewood     The new Lancet report on climate change is now out:   The number of older people dying from heat-related causes has doubled in under 20 years, a report revealed yesterday. Britain suffered an estimated 8,500 heat deaths among the over-65s in 2018 – more than twice the average for the years 2000 to 2004. Researchers blamed heatwaves and said healthcare is ‘at risk of being overwhelmed in the future’ unless drastic action is taken to halt climate change. The Lancet Countdown report said rising temperatures will increasingly threaten health, but cutting red meat consumption and air pollution can help. It stressed that heatwaves are one of the major health impacts of climate change and over-65s are the most vulnerable. The research also revealed the UK was hit by 5.6million hours of lost work in 2019 due to heatwaves. The climate crisis made 2019 a year of record temperatures, with a highest ever in the UK – 38.7C (101.66F) – in Cambridge. Figures show heat-related deaths of vulnerable people across the world have increased by 54 per cent in the past two decades, claiming 296,000 lives in 2018. https://www.dailymail.co.uk/news/article-9012029/Number-heat-related-deaths-65s-DOUBLED-20-years.html   The Lancet Countdown includes the usual junk science which I have repeatedly disproved every year. Rubbish like extreme weather, diseases, food security and reduced labour productivity. However, this year they have added a new section on heat mortality: https://www.lancetcountdown.org/ Although the report does not specifically give numbers for the UK, it is claimed that Britain suffered 8500 heat deaths amongst the over 65s in 2018, double the rate between 2000-2004. This claim clearly comes from the Lancet, as it has been plastered all over the media this week.     The report goes on:   # Paul Homewood comments:  I am sure the German government will be delighted to learn that its neglect of the elderly population has led to 20,200 heat deaths! But, of course, nobody has died with “heat related” written on their death certificates. As usual, with climate science, it is all based on computer models, which operate on a Garbage In, Garbage Out basis, otherwise known as GIGO. This model is programmed with the assumption that the hotter it is, the more likely old people are to die. For some reason, the Lancet conveniently forget to mention that cold kills far more people than warmth does. Worldwide, scientists have worked out that cold weather is 20 times as deadly as hot weather, even in hot countries such as India. Since this study was actually published by the Lancet in 2015, you might have thought they included it in their new findings! In Britain, of course, there are tens of thousands of excess deaths in winter. In contrast, summer months always record the lowest number of deaths in the year.: https://www.ons.gov.uk/peoplepopulationandcommunity/birthsdeathsandmarriages/deaths/bulletins/excesswintermortalityinenglandandwales/2018to2019provisionaland2017to2018final   As far as the UK is concerned, at least, there is no need for the Lancet to employ their shonky models. We have the actual mortality data, as supplied by the ONS. We cannot directly compare the summer of 2018, with that of 2004, because the total number of deaths occurring during the year as a whole has been steadily rising since around 2009. Currently annual death tolls are about 30,000 higher than in 2004: https://www.ons.gov.uk/peoplepopulationandcommunity/birthsdeathsandmarriages/deaths/bulletins/deathsregistrationsummarytables/2018 This is not because we all less healthy, but because the population is both getting larger and older. For example, there are now many more over 80s than there was two decades ago due to the fact that we are all living longer on average; and as that is when most people die, the number of deaths has also started to rise again. Put simply, death is playing catch up! That is why the ONS look at Age-Standardised Mortality rates when comparing trends. https://www.ons.gov.uk/peoplepopulationandcommunity/birthsdeathsandmarriages/deaths/bulletins/deathsregistrationsummarytables/2018     And when we look age-standardised mortality in July and August for over 75s, we find that even in 2018 it was much lower than in 2004. (The series only began in July 2020, so there are no figures for June): https://www.ons.gov.uk/peoplepopulationandcommunity/birthsdeathsandmarriages/deaths/bulletins/monthlymortalityanalysisenglandandwales/july2020#age-standardised-mortality-rates-by-sex-and-age-group-in-july-2020 https://www.ons.gov.uk/peoplepopulationandcommunity/birthsdeathsandmarriages/deaths/bulletins/monthlymortalityanalysisenglandandwales/july2020   And from the weekly registrations of deaths, we can also chart the summer deaths for over 65s: https://www.ons.gov.uk/peoplepopulationandcommunity/birthsdeathsandmarriages/deaths/datasets/weeklyprovisionalfiguresondeathsregisteredinenglandandwales   The heatwave summer of 2018 actually recorded the second lowest number of deaths in the five-year period. Clearly that heatwave had no measurable effect on death tolls amongst the elderly at all. All of this should have been very evident to the Lancet’s “experts”, and very easily accessible. We also know from COVID research this year that all other EU countries have similarly rigorous data available for mortality rates. So why did they choose to ignore all of this real world data, and instead use phony results from dodgy computer models?

For more results click below