Search Results for: satellite data sea level

New Study: Tide gages find no global ‘acceleration in sea level’ – But satellite data ‘manipulated’ to show acceleration

Via: http://www.ijesi.org/papers/Vol(6)8/Version-1/G0608014851.pdf Abstract: Sea level changes is a key issue in the global warming scenario. It has been widely claimed that sea is rising as a function of the late 20th’s warming pulse. Global tide gauge data sets may vary between +1.7 mm/yr to +0.25 mm/yr depending upon the choice of stations. At numerous individual sites, available tide gauges show variability around a stable zero level. Coastal morphology is a sharp tool in defining ongoing changes in sea level. A general stability has been defined in sites like the Maldives, Goa, Bangladesh and Fiji. In contrast to all those observations, satellite altimetry claim there is a global mean rise in sea level of about 3.0 mm/yr. In this paper, it is claimed that the satellite altimetry values have been “manipulated”. In this situation, it is recommended that we return to the observational facts, which provides global sea level records varying between ±0.0 and +1.0 mm/yr; i.e. values that pose no problems in coastal protection. Keywords: Manipulation, observational facts, satellite altimetry, sea level change, tide gauges ————————————————————————————————————————————— Date of Submission: 26-07-2017 Date of acceptance: 05-08-2017 … V. CONCLUSION Satellite altimetry is a new elegant tool to view the changes in sea level over the globe, maybe especially the spatial changes, which, indeed, verified the long-term notion that sea level change over the last 5000-6000 years are dominated by the redistribution of water masses [29]. The temporal changes, on the other hand, has always remained very questionable as they seem to over-estimate observed sea level changes by 100-400% [9-16]. It seems quite weird to claim that it would be the satellite altimetry that is right and that the true observations in the field are wrong (still this is what the people around the IPCC and the Paris agreement at COP21 continue to claim). Fig. 1 reveals what is going on. It is the satellite altimetry data, which have been “corrected” to give a rise in the order of 3.0 mm/yr. This “correction” [19-21] may, of course, be classified as a “manipulation” of facts, like the manipulation temperature measurements recently revealed [1-3]. In this situation, there are all reasons to return to solid observational facts [11-16].Those facts are controllable, and this is a key criterion in science.The global perspective is general stability to a minor rise with variations between ±0.0 and +1.0 mm/yr [16]. This poses no problem for coastal protection. Therefore, we should free the world from the horror issue that low-lying coasts and islands will become seriously flooded in this century. Up to the present, there has been no convincing recording of any acceleration in sea level, rather the opposite: a total lack of any sign of an accelerating trend. For full study see here. # End study excerpt Related Links: Sea levels have been rising since the last ice age ended more than 10,000 years ago. There is currently no acceleration in sea level rise. Sea level rise hysteria can be cured by looking at tide gauge data Sea Level 2000 years ago higher than today? Roman coastline discovered two miles inland Bjorn Lomborg About Those Non-Disappearing Pacific Islands – ‘Total land area of the islands has actually grown’ Former NASA Climatologist Dr. Roy Spencer in 2016: “Sea level rise, which was occurring long before humans could be blamed, has not accelerated and still amounts to only 1 inch every ten years. If a major hurricane is approaching with a predicted storm surge of 10-14 feet, are you really going to worry about a sea level rise of 1 inch per decade? Climatologist Dr. Judith Curry of Georgia Institute of Technology: ‘Sea level will continue to rise, no matter what we do about CO2 emissions.’ – ‘The IPCC figure 3.14 suggests that there is no acceleration, given the large rates of sea level rise in the first half of the 20th century.  Until we have an understanding of variations in decadal and multi-decadal sea level rise, we can’t make a convincing argument as to acceleration.’ Meteorologist Tom Wysmuller: ‘For the past 130 years there has been ZERO acceleration in sea-level rise as directly measured by tide gauges in tectonically inert areas (land neither moving up nor down), even as CO2 has risen almost 40% in the same period.’ Peer-Reviewed Studies Demolish Warmists’ Sea Level Rise Scares: ‘Decelerated 44% since 2004′ – ‘Global sea levels have been naturally rising for ~20,000 years and have decelerated over the past 8,000 years, decelerated over the 20th century, decelerated 31% since 2002 and decelerated 44% since 2004 to less than 7 inches per century. There is no evidence of an acceleration of sea level rise, and therefore no evidence of any effect of mankind on sea levels. Global sea level rise from tide gauges (1.6 mm/year) is half of that claimed from satellites (3.2 mm/year). Which is right? – ‘There is no acceleration of the increase’ – [Climate Depot Note: According to tide gauges, Sea Level is rising LESS than the thickness of one nickel (1.95 mm thick) per year or about the thickness of one penny (1.52 mm thick) a year. According to satellite info it is rising slightly more than two pennies a year (3.04 mm)]

Here we go again: Satellite sea level data ‘adjusted’ to show acceleration – ‘Climate Mafia At Work On Sea Level’

Posted on July 22, 2017 by tonyheller One week after they forced Carl Mears into compliance over satellite temperatures, the climate mafia has forced the University of Colorado into compliance over satellite sea level measurements. The numbers didn’t add up. Even as Earth grew warmer and glaciers and ice sheets thawed, decades of satellite data seemed to show that the rate of sea-level rise was holding steady—or even declining. Nerem’s team calculated that the rate of sea-level rise increased from around 1.8 millimetres per year in 1993 to roughly 3.9 millimetres per year today as a result of global warming. Satellite Snafu Masked True Sea Level Rise for Decades – Scientific American The same story repeats itself over and over again. Climate scientists adjusting the data to increase the imaginary effects of global warming. see Tony Heller’s Video:  Never mind that Antarctica is gaining ice, not losing it, causing sea level to fall. NASA Study: Mass Gains of Antarctic Ice Sheet Greater than Losses | NASA Never mind that the surface of Greenland has gained more than 600 billion tons of ice over the past year, causing sea level to fall. Greenland Ice Sheet Surface Mass Budget: DMI Never mind that tide gauges don’t show any increase in the rate of sea level rise, much less a doubling. Sea Level Trends – State Selection Sea Level Trends – State Selection Sea Level Trends – State Selection Global Sea Level Trends – Mean Sea Level Trend The latest claims are more than double what tide gauges show. Sea Level Trends – Global Regional Trends Ninety percent of tide gauges show less sea level rise than the latest satellite adjustments. Sea Level Trends – MSL global stations trends table The climate mafia is also at work trying to increase the rate of tide gauge sea level rise, but individual stations don’t show this increase. NASA 1982NASA 2016

National Snow & Ice Data Center (NSIDC): Past 3 years in a row set ice record! ‘Sea ice in Antarctica has remained at satellite-era record high daily levels for most of 2014’

Figure 6c. Monthly Antarctic September ice extent for 1979 to 2014 shows an increase of 1.3% per decade relative to the 1981 to 2010 average. Credit: National Snow and Ice Data Center High-resolution image On September 22, 2014, Antarctic ice extent increased to 20.11 million square kilometers (7.76 million square miles). This was the likely maximum extent for the year. This year’s Antarctic sea ice maximum was 1.54 million square kilometers (595,000 square miles) above the 1981 to 2010 average maximum extent, which is nearly four standard deviations above this average. The 2014 ice extent record is 560,000 square kilometers (216,000 square miles) above the previous record ice extent set on October 1, 2013. Each of the last three years (2012, 2013, and 2014) has set new record highs for extent in the Antarctic. The monthly average Antarctic ice extent for September 2014 is 20.03 million square kilometers (7.73 million square miles). This is 1.24 million square kilometers (479,000 square miles) above the 1981 to 2010 average for September ice extent. The Antarctic sea ice trend for September is now +1.3% per decade relative to the 1981 to 2010 average. … A comparison of ice extent (Figure 6a) with ice concentration trends (Figure 7) illustrates that the areas of unusual ice growth are in the same places that have been showing ongoing trends of increased ice extent. This suggests that wind patterns play a significant role in the recent rapid growth in Antarctic ice extent. However, another possible reason is that recent ice sheet melt, caused by warmer, deep ocean water reaching the coastline and melting deeper ice, is making the surface water slightly less dense. While the change in saltiness is too small to significantly affect the freezing temperature, the increase in slightly less dense water surrounding Antarctica inhibits mixing, creating conditions that favor ice growth (as we discussed in our July 17 post).

Surprise! Two new studies find ice is rebounding at BOTH poles! ‘Surprising pause’ in Arctic sea ice decline & Antarctica sees ‘record-breaking accumulation of ice’

  https://nypost.com/2025/05/06/opinion/ice-rebounds-at-both-poles-climate-more-complex-than-known/ Roger Pielke Jr. is a senior fellow at the American Enterprise Institute who writes at The Honest Broker on Substack. Excerpt: Two new studies show that the Earth’s climate is far more complex than often acknowledged, reminding us of the importance of pragmatic energy and climate policies. One of them, led by researchers at China’s Tongji University, finds that after years of ice sheet decline, Antarctica has seen a “surprising shift”: a record-breaking accumulation of ice. The paper takes advantage of very precise measurements of Antarctic ice mass from a series of NASA satellites called GRACE (Gravity Recovery and Climate Experiment). Since the first GRACE satellite was launched in 2002, Antarctica has seen a steady decline in the total mass of its glaciers. Yet the new study found the decline reversed from 2021 to 2023. Melting Antarctic ice contributes to global sea-level rise, so a reversal of melting will slow that down. Understanding the dynamics of ice mass on Antarctica is thus essential. The recent Antarctica shift makes only a small dent in the overall ice loss from 2022, but comes as a surprise nonetheless. [Via: Pielke Jr.’s blog post Ice Surprises: At the South Pole, Wang et al. 2025 find a record accumulation of ice on the Antarctic ice sheet over the period 2021 to 2023, following a steady decrease from 2002 to 2021. The data comes from NASA’s GRACE series of satellites, which have the ability to precisely measure ice mass. The figure below shows that the recent accumulation is small in the context of the multi-decadal decline, but is still characterized by the paper’s authors as a “significant reversal.” The paper makes no predictions of whether or how long the accumulation might continue.] … A second new paper, a preprint now going through peer review, finds a similar change at the opposite end of the planet. “The loss of Arctic sea ice cover has undergone a pronounced slowdown over the past two decades, across all months of the year,” the paper’s US and UK authors write. They suggest that the “pause” in Arctic sea ice decline could persist for several more decades. [Via: Pielke Jr.’s blog post Ice Surprises:  At the other end of the planet, at the North Pole, a new preprint by England et al. identifies a “surprising, but not unexpected multi-decadal pause in Arctic sea ice loss.”] In 2009, then-Sen. John Kerry warned that the Arctic Ocean would be ice-free by 2013: “Scientists tell us we have a 10-year window — if even that — before catastrophic climate change becomes inevitable and irreversible,” he said. Today, six years after that 10-year window closed, catastrophic climate change has not occurred, even as the planet has indeed continued to warm due primarily to the combustion of fossil fuels. Partisans in the climate debate should learn from Kerry’s crying wolf. On one side, catastrophizing climate change based on the most extreme claims leads to skepticism when the promised apocalypse fails to occur on schedule. … History tells us that climate can shift abruptly, with profound consequences for society. For instance, the 1870s saw a wide range of climate extremes across the planet, by some estimates contributing to the deaths of 4% of global population. More recently, the climate extremes of the 1970s led to many new US government programs focused on monitoring and researching climate, such as the National Oceanic and Atmospheric Administration.  

‘Arctic sea ice continues to show resiliency…nearly normal temperatures expected during the all-important summer melting season’

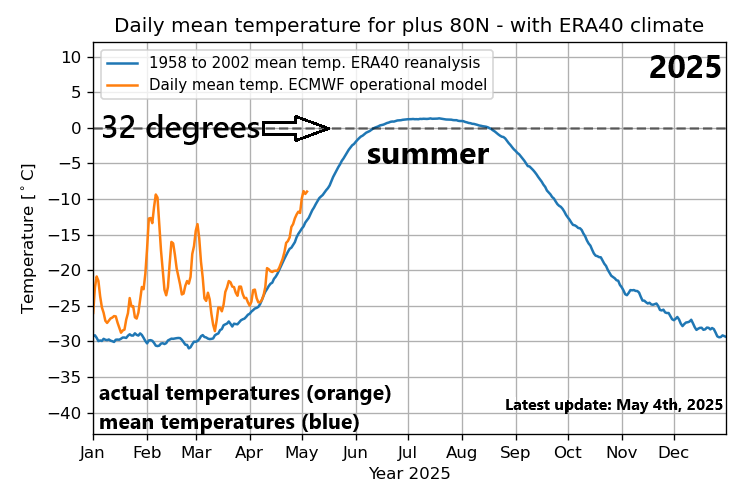
https://arcfieldweather.com/blog/2025/5/5/arctic-sea-ice-continues-to-show-resiliencynearly-normal-temperatures-expected-during-the-all-important-summer-melting-seasonpossible-important-role-of-water-vapor By Meterologist Paul Dorian This plot compares actual temperatures (orange) to mean temperatures (blue) in the Arctic region during 2025. Following long-term trends, temperatures during these cold season months have been generally running at above-normal levels. And if long-term trends hold true for the summer (melting) season, then temperatures in June, July, and August should run at nearly normal levels which happens to be right around the 32 degree (F) mark. As long as temperatures remain close-to-normal during the summer (melting) season, there will likely be a limit to the amount of additional melting that can take place with respect to the Arctic sea ice. Data courtesy Danish Meteorological Institute Overview The summer season is fast approaching, and probabilities are high that overall temperatures in the Arctic region will be nearly normal which happens to be right around the 32 degree (F) freezing mark. Chances are indeed high since this temperature pattern of nearly normal conditions during the summer months of June, July, and August has taken place virtually every year since the turn of the century. Meanwhile, the other nine months of the year in the Arctic region have featured above-normal temperatures in a pattern that too has also been very consistent in recent years. It is the temperatures in the summer months of June, July, and August, however, which are the most important when it comes to Arctic sea ice extent as this is the melting season up in that part of the world. Arctic sea ice extent has been running at below-normal levels since the middle 1990’s; however, if temperatures again remain nearly normal during the summer (melting) season, the chance for any additional significant drop off will be limited. Indeed, given this consistent summertime temperature trend in recent years, Arctic sea ice has shown resiliency both in terms extent and in volume. One possible explanation of this persistent temperature pattern across the Arctic region featuring nearly normal summertime conditions and warmer-than-normal during the coldest nine months of the year is the increased levels of water vapor in the atmosphere. The temperature pattern in the Arctic region during 2024 featured nearly normal levels during the summer (melting) season and above-normal conditions during the other (coldest) nine months of the year. Data courtesy Danish Meteorological Institute Arctic temperatures and the impact on sea ice Temperatures have followed a persistent trend in the Arctic region during the past several years, in fact, this pattern has persisted going all the way back to the beginning of the 21st Century.  Specifically, temperatures have been running at nearly normal levels during the all-important summer (melting) season of June, July, and August, and then usually at well above-normal levels during the remaining nine months of the year. The temperature pattern in the Arctic region during the last several years has featured nearly normal levels during the summer (melting) season of June, July, and Augusts, and above-normal conditions during the other (coldest) nine months of the year. In fact, this kind of annual temperature pattern in the Arctic region has been quite consistent since the turn of the century. Data courtesy Danish Meteorological Institute Nearly normal temperatures in the months of June, July and August are typically at levels near or just above the freezing mark and as long as they remain there during the melting (summer) seasons chances of any additional significant drop-off in Arctic sea ice will be limited. Well above-normal temperatures in the other nine months of the year has a minimal impact on the melting of Arctic sea ice as they are typically well below the freezing mark. Indeed, with this dependable temperature trend in recent years, Arctic sea ice has been rather resilient both in terms of extent and volume, going back a dozen years or so. Anomaly of the +80N mean temperature index is shown here back to 1960, compared with climate (annual mean minus the corresponding climate value). “All year” anomaly is illustrated with the black line and has climbed since the middle 1990s. The “summertime” anomaly of June, July, and August is illustrated with red and has held at nearly normal levels. An important shift in the Atlantic Multidecadal Oscillation (AMO) took place during the middle 1990’s (indicated by arrow) when it flipped from a “negative-to-positive” phase. Reference climate is ECMWF-ERA40 1958-2002. Plot courtesy Danish Meteorological Institute Arctic sea ice extent has been running at below-normal levels since the middle 1990’s at which time there was an important shift in the Atlantic Multidecadal Oscillation (AMO) to one featuring warmer-than-normal sea surface temperatures in the North Atlantic Ocean. The Arctic sea ice extent headed steadily downward after that shift and reached its lowest point in 2012 at levels not seen before during the satellite era which goes back to the late 1970’s. Since then, however, Arctic sea ice extent has held rather steady with a general sideways trend during the past dozen years or so. Some recent studies confirm the “resiliency” seen during recent years in Arctic sea ice extent and have found that it not only has been detected during the month of September – the time of annual minimum – but has been evident in each and every other month of the year. Arctic sea ice volume as estimated by the University of Washington’s PIOMAS numerical model shows resilience during the last dozen years or so with a “sideways” trend (boxed in region). This model output data is updated on a monthly basis and is shown here through March 2025. Details on the PIOMAS model are available here. In addition to sea ice extent, an important climate indicator to monitor is sea ice volume as it depends on both ice extent and thickness. Arctic sea ice volume is difficult to monitor on a continuous basis as observations from satellites, submarines and field measurements are all limited in space and time. As a result, one of the best ways to estimate sea ice volume is through the usage of numerical models which utilize all available observations. One such computer model comes from the University of Washington and is called the Pan-Arctic Ice Ocean Modeling and Assimilation System (PIOMAS, Zhang and Rothrock, 2003). This model-derived Arctic sea ice volume shows a steady downward trend from the middle 1990s to the low point reached in 2012 and then a general sideways trend until the present time. Relative humidity (left) and surface temperatures (right) have averaged higher-than-normal during the wintertime in the Arctic region (indicated by arrows) for the last ten years (2014-2024). An increase in water vapor (and relative humidity) in the cold, dry cold season of the Arctic can have much more impact on air temperatures as compared to during the warmer, and more humid summer (melting) season. Maps courtesy NOAA/NCAR The possible important role of water vapor One possible explanation for the behavior of temperatures in the Arctic region during the past couple of decades has to do with increased amounts of water vapor in the atmosphere. Overall, water vapor content has been higher-than-normal in the Arctic region during the past couple of decades largely as the result of warmer-than-normal sea surface temperatures in both the North Atlantic (positive AMO) and the Pacific Ocean (multiple El Nino events). Given the warmer-than-normal water temperatures, there has been increased evaporation and this, in turn, generates more overall water vapor in the atmosphere. An increase in water vapor will have a much bigger impact on temperatures in very cold and dry environments and less of an impact on warmer and more humid atmospheres. In other words, an increase in overall water vapor could very well result in warmer-than-normal temperatures during the coldest nine months of the year in the Arctic region when it is typically very cold and dry, and likely have far less impact during the warmer, more humid summer (melting) season. Meteorologist Paul Dorian Arcfield arcfieldweather.com

For more results click below